

What if deciding when to get out of the stock market before a crash is less about spotting the crash and more about knowing your risk limits? It’s reasonable to worry that warning signs may point to a deeper decline. It’s just as reasonable to worry about selling too soon, locking in losses, or missing a rebound. Headlines can heighten that uncertainty, but they can’t replace a decision rule based on your portfolio, time horizon, and tolerance for risk.
This guide shows how to separate market prediction from risk management, and how to assess whether staying invested, reducing exposure, or exiting fits your circumstances. You’ll learn to set and review portfolio thresholds, assess market signals without treating them as guarantees, and compare the trade-offs of each response. Alpha Shield’s Market Signal and Dashboard provide a systematic input for monitoring market health and potential drawdowns. They don’t predict the exact timing of a crash or eliminate losses. The aim is to build a repeatable process, so volatility doesn’t make the decision for you.
Key Takeaways
- Learn how to distinguish routine volatility from a sharper market decline without treating every warning as a crash forecast.
- Use price trends, volatility, and economic context as separate inputs, and account for the fact that they may not point in the same direction.
- Compare staying invested, reducing exposure, and exiting fully by weighing liquidity, participation in a recovery, and fit with your plan.
- Decide when to get out of the stock market before a crash by setting portfolio thresholds and review rules ahead of volatile periods, not in reaction to headlines.
- See how the Alpha Shield Market Signal and Dashboard can support consistent market-risk monitoring as part of a broader decision process.
When to Get Out of the Stock Market Before a Crash: Start with the Limits of Prediction
Wanting to protect wealth built over years of investing is rational. The challenge is separating portfolio risk that calls for action from the discomfort of watching prices move. A sharp decline can reduce account values, but selling in response to every unsettling signal can create another problem: leaving your plan without knowing what would bring you back in.
A market crash is a sharp, significant fall in market prices. It differs from routine volatility, the ordinary fluctuations that occur as investors respond to new information and changing expectations. There’s no single threshold that makes every decline a crash. The Stock market crash overview describes historical episodes with varied causes, illustrating why a market drop should be assessed in context rather than labelled by fear alone.
A warning sign indicates changing risk, not certainty about a decline’s timing, cause, or magnitude. Risk management responds to observable conditions and portfolio limits. Prediction claims to know what happens next.
Can anyone know the exact moment to leave stocks?
Turning points look clearer in hindsight. After a decline, earlier price weakness or economic stress may seem like an obvious warning. In real time, those same conditions can persist without a crash, or worsen after investors have already sold. Observable facts, such as a falling index or rising volatility, describe current conditions. They don’t prove a crash is imminent.
Any decision process can produce false alarms or missed signals. Treat a warning as a reason to review your exposure against your plan, not as automatic proof that you should sell. Ask what evidence would change your decision, and what evidence would support staying invested.
Why an all-or-nothing exit can create its own risk
Selling after a decline can lock in losses. If prices recover while you’re in cash, you may miss part of that rebound. Deciding when to re-enter adds another timing decision. Cash can reduce exposure to falling share prices, but inflation may erode its purchasing power, and waiting to reinvest can leave money out of the market if conditions improve.
The right balance depends partly on your time horizon and cash needs. Money needed soon may call for a different level of market exposure than money invested for a distant goal. Before asking when to get out of the stock market before a crash, identify the specific risk you’re managing:
- Would a decline disrupt a near-term cash need?
- Does your current exposure exceed the level you can tolerate?
- What conditions would prompt you to reduce exposure, hold steady, or reinvest?
These questions turn a broad fear into a portfolio decision. A reasoned adjustment can be appropriate without assuming you can forecast the next crash. The objective is to choose an exposure you can maintain through uncertainty, then review it against defined conditions instead of reacting to each headline.
How to Read Market Risk Without Mistaking a Warning for a Crash Forecast
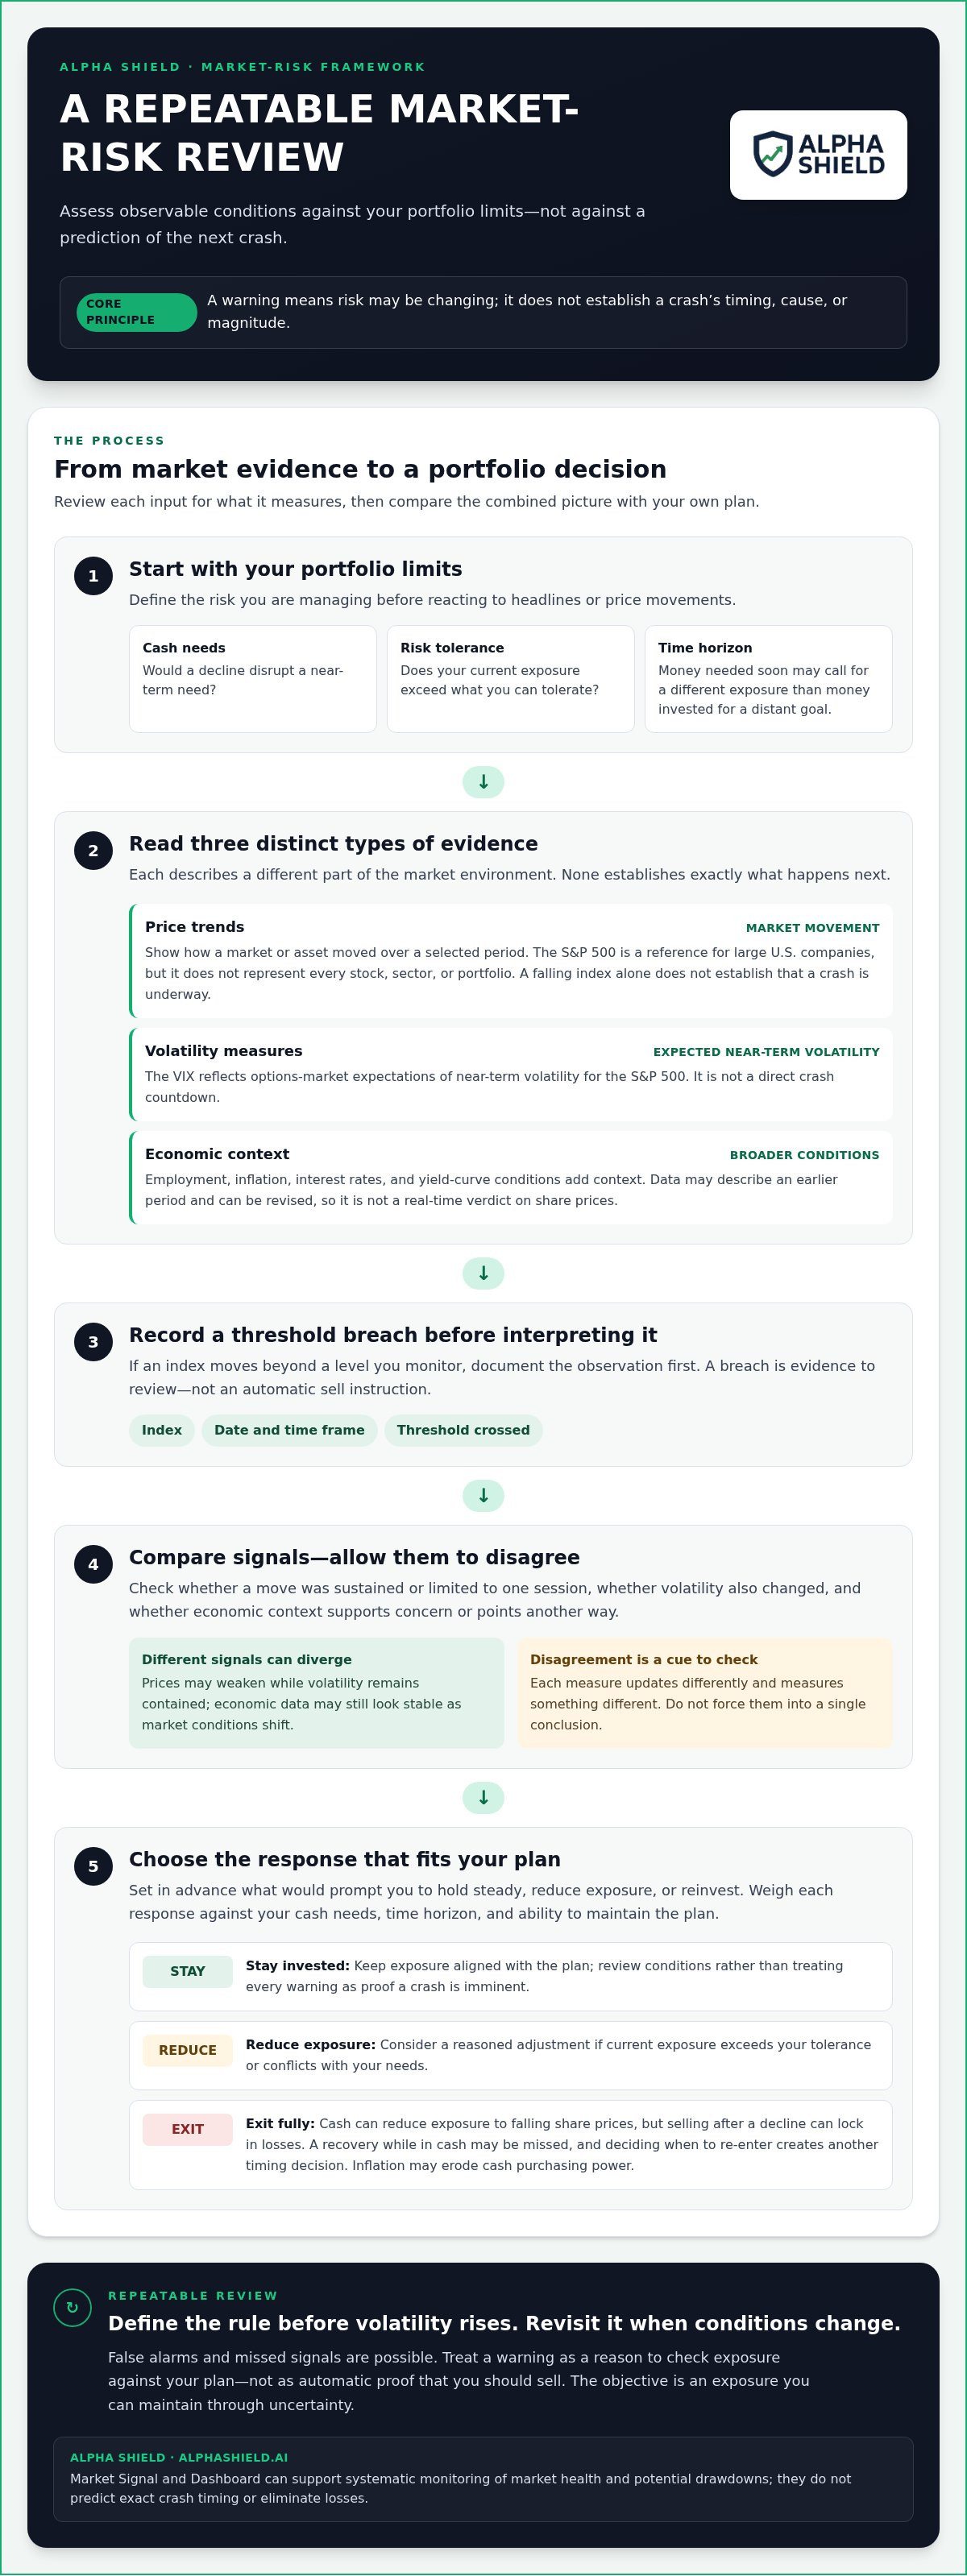
Market risk is easier to interpret when you separate the evidence into three categories: price trends, volatility conditions, and broader economic context. Each describes a different part of the environment. Together, they can support a more consistent review, but none can establish exactly what the market will do next.
Read indicators for what they measure
Price trends show how a market or asset has moved over a selected period. The S&P 500 is a widely used reference for large U.S. companies, but it can’t represent every stock, sector, or investor’s portfolio. A rising index may conceal weakness in parts of the market. A falling index doesn’t by itself establish that a crash is underway.
Volatility measures add another perspective. The VIX reflects options-market expectations of near-term volatility for the S&P 500. It isn’t a direct crash countdown. On October 16, 2026, the VIX stood at 16.46, according to the supplied market data. That reading is a dated observation, not a forecast of when a downturn will begin or how deep it could become.
Economic indicators, such as employment, inflation, interest rates, and yield-curve conditions, provide broader context. They may be published after the period they describe and can be revised as more information arrives. Treat them as context, not a real-time verdict on share prices. No single market or economic indicator establishes a crash date.
Separate the threshold breach from its meaning
A threshold breach is an observation. Interpreting it is a separate step. If an index falls below a level you monitor, record the index, date, time frame, and threshold crossed before deciding what the movement means. Then compare it with other evidence. Was the move sustained or limited to one session? Did volatility also change? Does the economic context support concern, or point in another direction?
Indicators can disagree because they measure different things and update on different schedules. Prices may weaken while volatility remains contained. Economic data may still look stable even as market conditions shift. Disagreement isn’t a reason to force a single conclusion. It’s a prompt to check what each measure can actually tell you.
Filter headlines through a consistent review
Dramatic news can signal uncertainty without confirming a market turning point. A one-day drop, a sharp rebound, or a forceful prediction in the news may feel decisive, but none should replace a consistent review schedule. Record the evidence, compare it with thresholds set in advance, and note whether it changes your assessment. This makes it easier to evaluate when to get out of the stock market before a crash without treating a headline as an instruction.
For a deeper explanation of how different measures fit together, explore this macro market risk indicators guide. Investors looking for a structured input for monitoring market conditions can also review Alpha Shield’s approach to systematic market-risk monitoring.
Should You Stay Invested, Reduce Exposure, or Exit Before a Crash?
There isn’t one response that suits every investor. The choice depends on your goals, time horizon, cash needs, and capacity to tolerate losses. Compare the trade-offs against your plan rather than treating a market warning as an automatic instruction to sell.
| Choice | Liquidity | Recovery participation | Decision complexity | Potential fit |
|---|---|---|---|---|
| Stay invested | Liquidity depends on the assets held and how quickly they can be sold. | Maintains exposure to potential market recoveries, as well as declines. | Lower if the current allocation still matches the plan. | May suit a long horizon, adequate cash reserves, and an allocation the investor can maintain through volatility. |
| Reduce exposure | Can create more available cash, depending on what is sold. | Retains some market exposure, but participates less if prices recover. | Requires rules for the size and timing of adjustments, and for any later rebalancing. | May fit changed cash needs, lower risk capacity, or an allocation that has moved beyond planned limits. |
| Exit fully | Moves the portfolio out of stocks, though cash still has its own risks and constraints. | Misses a recovery while out of the market; re-entry becomes another decision. | High, because both the exit and return need a rationale. | May fit a defined change in goals or liquidity needs, but should be assessed against the whole financial plan. |
A partial adjustment can feel less decisive than selling everything. It can also avoid making an all-or-nothing bet on the market’s direction. No option removes risk: staying exposed leaves the portfolio vulnerable to declines, while moving to cash can introduce inflation and reinvestment trade-offs. The right comparison is not “safe” versus “unsafe.” It’s which risks you can accept and manage.
When staying invested may fit the plan
A diversified allocation designed for a long investment horizon may remain appropriate through temporary declines, provided it still matches the investor’s goals and ability to bear losses. Someone without a near-term cash need may tolerate volatility differently from someone relying on portfolio withdrawals soon. Staying invested shouldn’t mean ignoring changed circumstances. Review the allocation if a new cash need or goal changes the plan.
When reducing stock exposure may deserve consideration
A deliberate reduction may be worth evaluating if liquidity needs have changed, risk capacity has fallen, or stock exposure has drifted outside the allocation rules. Rebalancing toward a chosen allocation is different from trying to sell at the exact market peak. Set the intended adjustment and review conditions in advance, then follow them consistently. For broader portfolio-planning context, see this guide to systematic risk mitigation.
So, when to get out of the stock market before a crash? Start by identifying which part of your plan, if any, has changed. If a structured market-risk input would help you review conditions alongside that plan, explore Alpha Shield’s market-risk tools.
Set a Pre-Crash Plan Before Market Volatility Rises
A useful plan turns a difficult market question into a repeatable process. Write it while conditions are relatively calm, then follow the same sequence when volatility increases. The goal isn’t to eliminate uncertainty. It’s to make sure each portfolio decision has a defined purpose, evidence, and review point.
- Define the goal. Identify which financial goals depend on the portfolio and when you may need those funds. Money needed for near-term spending may require a different approach from assets intended for a distant goal.
- Assess liquidity. Review expected withdrawals, income sources, and other accessible funds. Set a level of liquidity that fits your circumstances rather than relying on a universal cash target.
- Set review rules. Choose a consistent review cadence and specify what conditions will trigger a closer look. Define the evidence to assess, such as portfolio allocation, price trends, or market-risk indicators.
- Evaluate the evidence. Separate the observed condition from your interpretation. Check whether the threshold was crossed, whether other evidence supports the concern, and whether your goals or ability to tolerate risk have changed.
- Document the action. Record whether you’ll maintain exposure, adjust it, or take no action. Note why, what would prompt another review, and when that review will occur.
Build personal thresholds around goals and risk capacity
Thresholds should connect to your financial plan, not just a market chart. For example, an approaching planned withdrawal may justify reviewing liquidity and exposure even if market conditions are stable. A market signal may also prompt a review without requiring an immediate portfolio change. Write down the trigger, the information you’ll assess, and the actions you consider acceptable, including when no action is warranted.
Review a signal consistently, then act proportionately
Use the same cadence and criteria rather than rewriting the rules after each headline. If a trigger is reached, assess it against your goals and risk capacity before changing exposure. A signal informs the decision; it doesn’t determine the market outcome. Keep a short record of the signal, portfolio context, decision, and next review date. This creates accountability and helps distinguish a planned adjustment from a reaction made under pressure.
For more approaches to structured preparation, explore these market crash defense strategies. A consistent review process can also use a systematic market-risk input alongside your own decision rules.
Alpha Shield’s Market Signal offers a systematic input for monitoring market risk as you apply your plan and review rules.
How Alpha Shield Supports a Systematic Market-Risk Decision
A market-risk tool is most useful when it supports a decision process rather than replacing one. The Alpha Shield Market Signal and Alpha Shield Dashboard help investors monitor market health and manage potential drawdowns. They can provide a consistent reference point during a review, but they can’t establish the exact timing of a crash or determine the right exposure for every investor.
What a systematic market signal can add
A consistent signal can help structure observation during higher-risk periods. Instead of relying on a stream of headlines, an investor can review market-health indicators alongside the thresholds and portfolio context already documented in a plan. If the signal changes, use that as a prompt to review: what is the portfolio’s current exposure, has the investor’s situation changed, and does the evidence meet the plan’s criteria for action?
The next step remains the investor’s. A signal is not a guaranteed crash forecast, an automatic trade, or an individualized recommendation. It doesn’t decide whether to stay invested, reduce exposure, or exit. It provides information to consider within a broader process, with decisions tailored to the investor’s goals, time horizon, liquidity needs, and capacity for risk.
What to understand before relying on any signal
Signals can be wrong, change as conditions evolve, or fail to capture every source of risk. A reassuring reading can’t rule out a sudden market shock, and a higher-risk reading doesn’t prove that a crash is imminent. Treat the signal as one input, compare it with your portfolio circumstances, and follow the review rules you set before volatility rose.
Use a practical sequence when reviewing it:
- Observe: Note the current signal and relevant dashboard indicators.
- Compare: Check them against your documented thresholds and portfolio context.
- Decide: Choose whether to maintain exposure, adjust it, or take no action under your plan.
- Record: Write down the rationale and when you’ll review the decision again.
This approach keeps the question of when to get out of the stock market before a crash tied to risk management, not a claim to know the future. Alpha Shield focuses on long-term capital preservation. It isn’t a source of individual stock picks or a shorting strategy. For another perspective on the limits and discipline of timing decisions, see this guide to evidence-based market timing.
To see how a systematic market signal can fit into your risk-review process, review the Alpha Shield Market Signal.
Make Your Next Decision Before the Next Market Shock
You don’t need a perfect forecast to make a more deliberate portfolio decision. You need a process you can follow when headlines grow louder: define what matters to your financial plan, decide what evidence warrants a review, and document what you’ll do next. That shifts the question of when to get out of the stock market before a crash away from guessing the date and toward managing exposure with intent.
Alpha Shield’s system development began in 2017, and the Market Signal launched in 2019. The company was founded by former investment bankers and global markets professionals with over 50 years of combined experience. Those foundations inform a systematic approach to monitoring market risk, without promising exact crash forecasts or guaranteed protection.
If you want a consistent market-risk input to consider alongside your own rules and circumstances, explore the Alpha Shield Market Signal.
Set your rules while conditions are calm. Then you can respond to volatility with greater clarity and confidence.
Frequently Asked Questions
Can anyone predict a stock market crash accurately?
No. No method can establish with certainty the exact date and depth of a stock market crash. Probabilistic risk assessment weighs conditions that may raise or lower risk; it doesn’t confirm a specific outcome. A signal can add context, but false alarms and missed events remain possible. Rather than treating a forecast as a trade instruction, tie decisions about when to get out of the stock market before a crash to precommitted rules and your time horizon.
How long does the stock market usually take to recover after a crash?
There’s no standard recovery timeline. It varies by downturn, market, and the measure used. An index returning to its previous level doesn’t mean every investor’s portfolio has recovered: holdings, contributions, withdrawals, and allocation all affect results. When reviewing historical examples, check the index and exact dates, and distinguish recovery to a prior level from recovery after inflation. Past recovery periods describe earlier events, not a schedule or guarantee for future markets.
How much cash should I keep outside the stock market before a crash?
There’s no universal cash amount. The right level depends on obligations, income stability, debt, and when you expect to use invested money. Separate emergency liquidity and planned near-term spending from cash held because you’re trying to time the market. For example, an upcoming expense may affect how much volatility you can tolerate. Map expected withdrawals first, then consider whether your current stock exposure fits those needs and your investment horizon.
Does a recession always cause a stock market crash?
No. Recessions and equity declines can be related, but they aren’t interchangeable events with a guaranteed one-to-one sequence. Markets may respond to expectations before a recession is officially identified, while economic data may arrive later or be revised. That timing means a recession indicator can’t provide a precise date to sell. Assess the effect of a possible downturn on your portfolio goals and risk capacity separately from the economic label.
What should I do if I already sold stocks before a crash?
Don’t rush into another decision just to correct the first one. Reassess why you sold, when you may need the money, and what allocation still fits your goals and ability to accept risk. Then document a measured investment or re-entry plan, including what conditions you’ll review. Trying to identify the perfect point to buy back creates another timing decision. The market’s next move isn’t knowable with certainty.
Is a market correction the same as a stock market crash?
No. The terms commonly describe declines of different severity, but definitions can vary by source and market. Avoid relying on a single percentage as a universal dividing line unless a source clearly defines it for the market being discussed. The label doesn’t determine the right portfolio response. For example, the same decline may have different implications for someone investing for a distant goal than for someone planning a withdrawal soon.
Can a market-risk signal tell me when to sell my investments?
No signal can guarantee the right selling moment or a specific outcome. Its value depends on its methodology, limitations, and fit with your goals and portfolio. Alpha Shield’s Market Signal and Dashboard provide a systematic input for monitoring market risk, not personalized advice, an automatic trade instruction, or a promise to avoid losses. Use a signal to inform your review process, then make decisions based on your circumstances.


