

You don’t need to predict a bubble’s peak to reduce its risks. To understand how to avoid losing everything in a stock market bubble, set a target asset allocation, rebalance when market moves push it off course, and keep tactical adjustments within five percentage points of that target. Reducing leverage can also lower the chance that a downturn forces you to sell at the wrong time.
It’s reasonable to worry that an overvalued market could erase years of progress. But reacting to every warning with an all-or-nothing move creates another risk: missing a recovery or locking in losses. A disciplined plan gives you practical steps to follow without relying on panic selling or a perfectly timed exit.
This article explains how rebalancing can limit concentration, why borrowing increases the risk of forced selling, and how steady investing can keep you aligned with a long-term plan. Historical drawdowns also offer a useful lesson: losses can be severe and recovery can take time, so it pays to establish risk controls before markets turn.
Key Takeaways
- Set a target asset allocation and use modest, rules-based adjustments to keep market gains from concentrating too much risk in one part of your portfolio.
- Review leverage as well as holdings; borrowing can increase the chance that a downturn forces you to sell investments at an unfavorable time.
- Steady investing can keep your plan moving without requiring you to predict a bubble’s peak or the market’s next recovery.
- Write down your response to downturns in advance so short-term volatility is less likely to trigger panic selling.
- Historical drawdowns show why risk controls matter: declines can be deep, and recovery can take time.
1. How can rules-based rebalancing reduce bubble risk?
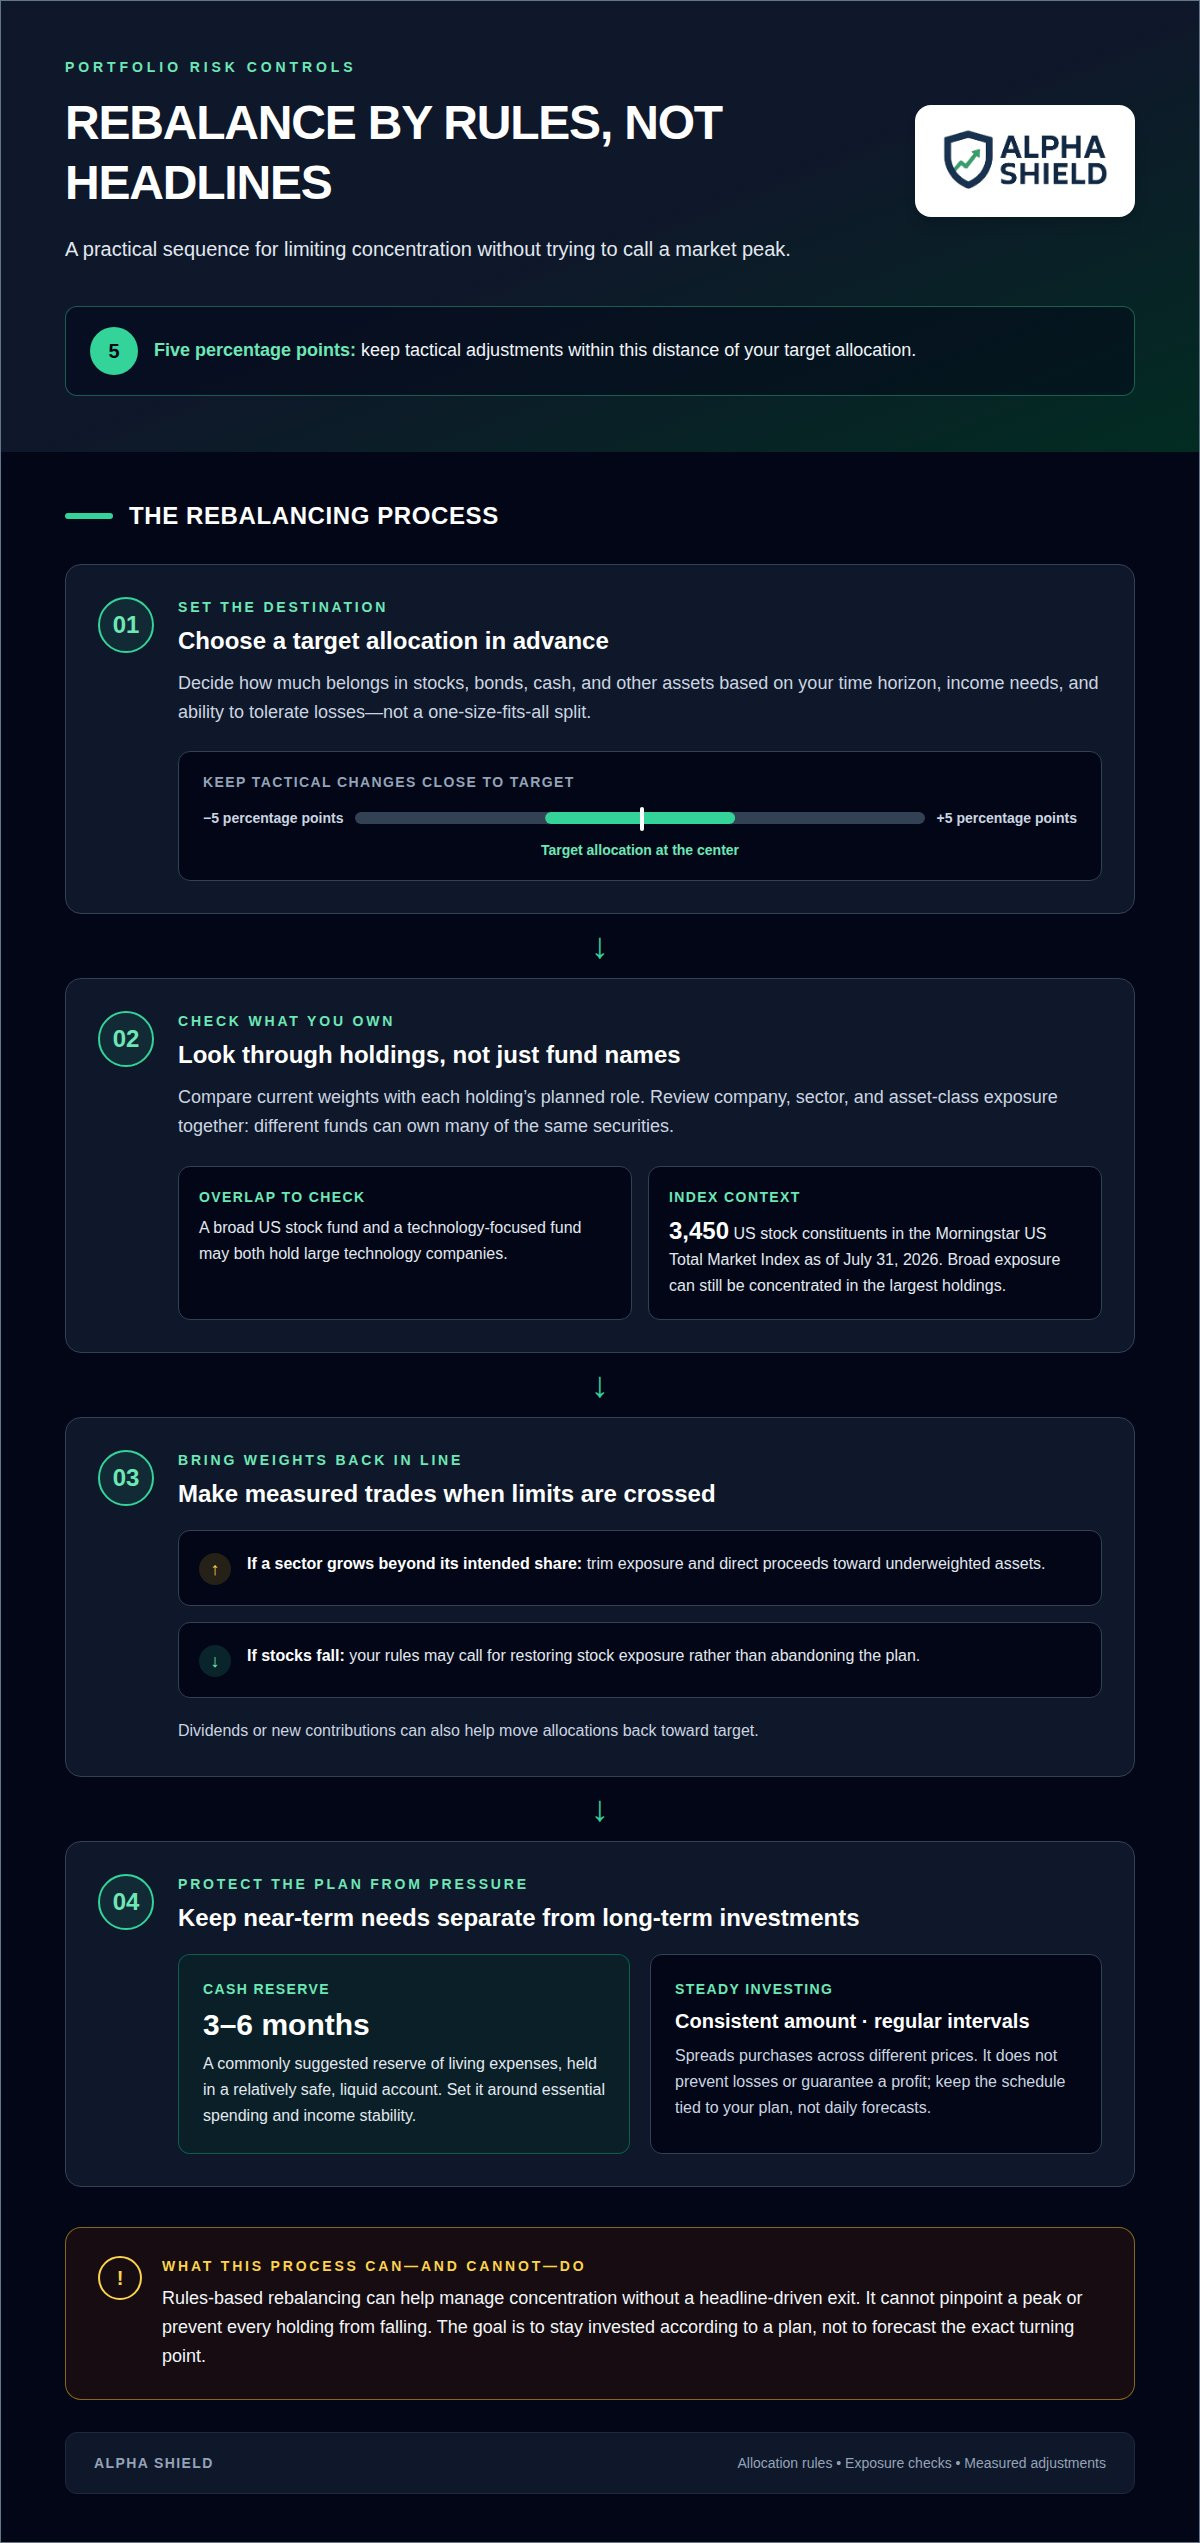
Rules-based rebalancing brings a portfolio back toward its target allocation when market moves alter its weights. Set that target before bubble headlines begin to dominate decisions. Keeping tactical adjustments within five percentage points of the target allows room to respond without turning a measured change into an all-or-nothing forecast. A practical way to think about how to avoid losing everything in a stock market bubble is to limit concentration before volatility rises.
To rebalance, compare each holding’s current weight with its planned role. If a fast-rising sector grows beyond its intended share, trim exposure and direct the proceeds toward underweighted assets. If stocks fall, your rules may call for restoring stock exposure rather than abandoning the plan. Dividends or new contributions can also help bring allocations back in line. The goal is to stay invested according to a plan, not to identify the exact peak.
How much should you diversify across stocks, bonds, cash, and other assets? Choose an allocation based on your time horizon, income needs, and ability to tolerate losses, rather than copying a fixed split. Diversify within asset classes, too. Owning several funds doesn’t guarantee broad exposure if they hold many of the same securities.
Check fund holdings, not only fund names. A broad US stock fund and a technology-focused fund, for example, may both own large technology companies. Their different labels can disguise a shared sector exposure. The Morningstar US Total Market Index included 3,450 US stock constituents as of July 31, 2026, but a broad index can still have substantial exposure to its largest holdings. Review company, sector, and asset-class weights together.
What is an appropriate emergency fund before investing in stocks? A commonly suggested reserve is three to six months of living expenses in a relatively safe, liquid account. Keeping this cash separate can reduce pressure to sell investments to cover near-term costs during a decline. Set the reserve based on essential spending and income stability, then invest money intended for longer-term goals.
How can dollar-cost averaging reduce the risk of investing near a market peak? Invest a consistent amount at regular intervals instead of committing all available money on one date. This spreads purchases across different market prices, but it doesn’t prevent losses or guarantee a profit. Keep the schedule tied to your plan, not daily forecasts.
How should you rebalance a portfolio during a bubble? Follow the allocation rules you set in advance, check for concentration, and make measured trades when exposures cross your chosen limits. If you’re considering how to avoid losing everything in a stock market bubble, this process can help manage risk without relying on a headline-driven exit. Rebalancing cannot pinpoint a peak or prevent every holding from falling.
2. Risks and trade-offs of strategies that differ from the market
A portfolio can differ from the market through active stock selection, sector tilts, dividend screens, or a larger cash allocation. Each choice may have a rationale, such as reducing exposure to expensive shares or emphasizing company income. But a strategy can underperform for a long time before its intended advantage appears. Abandoning it during that period can lock in the gap and mean missing a later recovery.
Manager selection adds another risk. In the 15 years covered by Morningstar’s Active/Passive Barometer report, 3.2% of active mutual funds in the US large-blend category survived and beat their passive counterparts. This result does not mean every active approach will fail. It does show why investors should examine fees, process consistency, turnover, and performance across different market conditions before replacing broad exposure with a manager’s judgment.
Factor and income strategies also carry trade-offs. The Morningstar US High Dividend Yield Index had the weakest returns among the approaches discussed over the preceding 15 years. A dividend focus may appeal to investors seeking income, yet it can leave a portfolio tilted toward particular industries or companies. A value tilt may behave differently from large-cap growth, but it can lag while market leadership remains concentrated elsewhere. A label alone doesn’t reveal the securities beneath it.
A stop-loss order instructs a broker to sell a security when its price reaches a specified trigger. In a volatile market, a brief drop can activate the order. If prices move quickly, the final execution price may differ from the trigger. That can turn a temporary decline into a realized loss, followed by the separate challenge of deciding when to reinvest.
Before adopting a strategy that differs from the market, write down what would make you keep it and what would lead you to change it. Check whether its holdings overlap with your existing funds, whether its sector exposure fits your broader plan, and whether you can tolerate periods of relative underperformance. Don’t treat recent performance as proof that a strategy will keep leading. A portfolio built around one forecast can become vulnerable if that forecast is wrong.
For a systematic view of changing market risk, investors can review market crash and drawdown signals alongside their own allocation rules. A signal can inform risk assessment, but it doesn’t replace a diversified plan or determine which individual securities to buy.
3. Avoiding attempts to time the market
Trying to exit before a bubble bursts requires two decisions: when to sell and when to return. Getting either wrong can leave an investor holding cash while prices recover. Market history gives a concrete warning: the S&P 500’s annualized total return from 2006 to 2025 would have been 6.6% if an investor missed that period’s top 10 days. Those days are only identifiable after they pass.
A market-timing rule can sound precise while relying on uncertain signals. Valuations, headlines, and falling prices may all suggest caution, but none identifies the exact turning point. If you sell because prices look stretched, decide in advance what evidence will trigger a purchase. Without that second rule, caution can turn into a prolonged absence from the market.
A historical MSCI World comparison illustrates the distinction between entry timing and a repeatable plan. Each of three investors contributed $7,000 over seven investment occasions between 1990 and 2022. The investor who bought at every market peak ended with roughly $25,207 by the end of August 2026. The example does not make peak buying desirable. It shows why a long horizon and continued participation can matter more than perfect entries.
Dollar-cost averaging offers a practical approach for money intended for long-term investment. Set an amount and schedule, then invest consistently rather than waiting for a forecasted bottom. This spreads purchases across market conditions. It cannot guarantee a favorable purchase price or remove the risk of losses. Its value is procedural: decisions are made in advance, not improvised after a sharp move.
Use a written plan to separate portfolio decisions from market predictions:
- Define the investment goal and the time horizon before changing exposure.
- Keep contributions on a set schedule, even when headlines turn negative.
- Revisit risk when your financial needs or ability to absorb losses change, not solely because prices moved.
- Diversify across suitable assets so the outcome does not depend on one company, sector, or forecast.
Staying invested doesn’t mean ignoring risk. It means making adjustments in line with a defined allocation or a real change in circumstances, rather than trying to call the peak. The goal isn’t a guarantee; it’s a repeatable process. If you set rules before volatility rises, you’ll have a clearer basis for action when fear or excitement pushes you toward an all-or-nothing decision.
4. Avoiding panic selling during downturns
A sharp decline can make selling feel like the only way to regain control. But selling turns a temporary market loss into an outcome shaped by your decision and timing. Before acting, pause and compare your reason for selling with your written investment plan. A change in income needs or the purpose of an investment may justify a review. A frightening headline alone doesn’t show that your portfolio’s long-term purpose has changed.
Consider the mechanical rules behind a panic response. One strategy sells investments when the market drops more than 2% in a day, then buys them back 20 days after selling if conditions look flat or better. That rule can sell during a brief fall, then leave the investor waiting while prices move. It also makes the re-entry decision depend on a later judgment about whether conditions look sufficiently stable.
Pause before placing a market order. Review what you own, why you bought it, and whether that reason still applies. Consider whether the position is needed for near-term spending or serves a longer-term goal. If your plan calls for holding through market declines, compare your current holdings with that plan before making a change. A written decision rule can stop one volatile trading day from dictating your entire strategy.
What are the U.S. tax consequences of selling investments during a market downturn? Selling in a taxable account can realize a gain or loss. The tax effect depends on the asset’s cost basis, sale price, and account type. A market decline alone doesn’t determine the tax result.
- Identify the specific reason for selling, such as a changed financial goal.
- Separate a change in a company’s outlook from a broad market decline.
- Review whether selling would alter your planned asset mix or cash needs.
- Record the decision and the evidence behind it before placing an order.
For example, imagine a company’s earnings weaken while its share price falls. That business-specific change deserves a different review from a broad selloff affecting many holdings. Assess the company’s financial outlook and the role its securities play in your plan. If the reason for owning it no longer holds, a measured sale may make sense. If the investment still serves its intended role, reacting to price movement alone may not.
Holding is not a rule to ignore new information. It means choosing to act on defined criteria rather than immediate fear. A downturn can test both the investment case and your ability to tolerate losses. Reviewing these separately can help distinguish a necessary portfolio change from an impulsive attempt to escape volatility.
5. Market drawdowns and long-term equity returns
A drawdown is a decline from a market or portfolio high. A bear market is an extended period of losses during which the market falls 20% or more. That threshold describes a decline, not its duration or eventual return. Investors need to assess both: how much risk they can bear during losses and how long their plan can remain invested.
History shows why a long horizon matters, but it does not promise a quick recovery. The Nikkei fell roughly 60% from its late-1989 peak to its mid-1992 low, and its decline from that peak remained unrecovered for decades. After the 1929 crash, the Dow did not fully recover until 1954. Those examples show that recovery times can vary sharply by market and period.
Other historical measures provide context, not a forecast. Since the 1930s, bear markets have lasted an average of 18 months. The average time for a stock portfolio to endure a bear market and fully recover its value has been just over three years. An average describes past experience; it cannot tell an investor how long a future decline will last.
How have diversified portfolios performed during past stock market crashes? Diversification can spread exposure across assets, so one holding or sector doesn’t determine the entire portfolio’s result. Even a diversified portfolio can lose value during a broad decline, and its return depends on its holdings and allocation.
The long-term record also differs from the path investors experience along the way. The S&P 500’s annualized total return from 2006 to 2025 was 11.0%. In the 32 years covered, it had no negative annualized return over holding periods of at least 11 years, with data as of December 31, 2025. Neither measure removes the possibility of losses during shorter periods.
Use these distinctions to keep a drawdown in perspective:
- Compare a decline with your plan’s risk limits, not only its latest high.
- Separate short-term losses from the time horizon for each financial goal.
- Review whether diversification still reflects your needs and risk tolerance.
- Avoid assuming that a historical average predicts the next recovery.
If you don’t plan to retire in the next decade, short-term market movements may matter less than your long-term goals. That doesn’t mean ignoring risk. It means keeping decisions aligned with your plan while reviewing whether your portfolio can withstand a prolonged decline.
Alpha Shield: Alpha Shield Market Signal
Alpha Shield Market Signal provides a systematic daily risk-on or risk-off signal to help investors navigate volatility and manage drawdown risk. It can give you a structured market-risk reference alongside your own allocation and rebalancing rules, rather than leaving you to rely on headlines or predict an exact market peak.
The Market crash and drawdown tool and Alpha Shield Dashboard provide a daily IN or OUT signal, with ETF allocation and position-sizing guidance. Use the signal as an input to a broader investment process, not as a substitute for diversification or a guarantee against losses. Alpha Shield focuses on long-term capital preservation, not day trading, shorting, or individual stock recommendations.
Visit Alpha Shield to explore the Market Signal subscription and dashboard.
Make your next portfolio review deliberate
Use the next calm period to turn your investment principles into a clear operating plan. Record what would justify changing your holdings, which decisions require a pause, and how you’ll distinguish a meaningful change in your circumstances from market noise. A written process makes it easier to act with purpose when prices move sharply.
A practical approach to how to avoid losing everything in a stock market bubble isn’t built around predicting the next headline. Start by deciding what risks you can accept, then choose review rules you can follow under pressure. Revisit those rules when your goals, income needs, or time horizon change. Clarity before volatility gives you a steadier basis for decisions.
For a structured way to incorporate market-risk signals into your investment process, explore Alpha Shield Market Signal and its dashboard.
Stay patient, make deliberate decisions, and give your long-term plan room to work.
Frequently Asked Questions
How can investors reduce leverage and forced-selling risk?
Reduce borrowing tied to investments and keep near-term spending needs separate from volatile assets. Borrowed money magnifies losses, while falling collateral values can prompt a lender to demand repayment or additional assets. Review margin agreements and other investment-related debt before volatility rises. If a forced sale would disrupt essential financial goals, reduce reliance on borrowing and maintain liquidity outside the portfolio.
How can rules-based rebalancing reduce bubble risk?
Use a written rule that states what portfolio change triggers a review and what action follows. For example, after a sharp rally, assess your total exposure instead of reacting to one fund’s recent return. Include overlapping holdings when measuring risk. This ensures your review reflects the portfolio’s combined exposures, not just the labels or number of accounts it contains.
What if you have terrible timing anyway?
A poor entry point doesn’t automatically invalidate a sound investment plan. First, check whether you’ll need the money soon or whether it has a longer-term purpose. Then assess whether your holdings still match that purpose and your capacity for losses. Don’t try to recover from a mistimed purchase through concentrated bets. A measured review of exposure and cash needs is more useful than making another decision under pressure.
What makes a bubble?
A bubble describes a market where prices rise well beyond what underlying financial prospects appear to support, often alongside strong speculative demand. Investors may buy because prices have risen, expecting further gains instead of focusing on cash flows or business performance. No single signal identifies every bubble in real time. Valuation, financing, expectations, and buying behavior all help frame the risk.
What should a long-term investor do?
Match investments to the date and purpose of each financial goal. Money needed for a near-term expense serves a different role from retirement savings intended to remain invested through market cycles. Review whether your portfolio’s risks still fit your circumstances, including income stability and planned withdrawals. Keep decision rules clear, and change your plan when its purpose or your financial situation changes.
When Markets Feel Like a Bubble: What Should Investors Do?
Separate observable portfolio risks from predictions about a market peak. Review concentration, borrowing, liquidity, and the purpose of each holding. Write down the specific changes that would justify an adjustment, then avoid making a major decision solely because a headline sounds alarming. If your review identifies a risk beyond your plan, address that exposure deliberately instead of making an all-or-nothing move across the entire portfolio.
Why do bubbles often begin with a kernel of truth?
Some bubbles begin around a real change, such as a new technology or a growing industry. Early evidence can support optimism, which may then grow into an expectation that prices will keep rising. Risk increases when investors treat future possibilities as established results. Distinguish a genuine business development from assumptions about how quickly it will produce profits or justify current prices.
Why does the bubble pattern repeat across different markets?
The underlying assets change, but investor behavior can follow familiar incentives. Rising prices attract attention, optimistic stories encourage more buying, and recent gains can make risk seem smaller than it is. Borrowing can amplify that feedback. Later, expectations shift or financing tightens, and demand reverses. Recognizing this pattern helps you examine what is supporting prices instead of relying on the market’s latest narrative.


