

If your portfolio drops by 50 percent, you don't need a 50 percent gain to recover. You need a 100 percent return just to reach your previous break-even point. This mathematical reality is known as the compounding fallacy. It's the primary reason a single market crash can destroy a decade of disciplined retirement savings. You likely recognize this danger, yet you're overwhelmed by conflicting news and constant market noise. Finding a reliable stock market drawdown indicator is often the only difference between long-term security and financial ruin. Most investors lack a rules-based exit strategy, leaving them vulnerable to emotional decisions during periods of high stress.
This guide provides a systematic path to capital preservation. You'll learn how to identify high-risk market regimes and use drawdown indicators to shield your wealth from catastrophic losses. We'll move past the sensationalism of retail trading and focus on institutional-grade risk management. You'll discover how to filter out the noise and implement a sober, data-driven approach to market volatility. This article outlines a clear method for identifying when to stay invested and when the risk of a major drawdown outweighs the potential for gain. We're replacing guesswork with professional discipline.
Key Takeaways
- Define your maximum tolerable loss and establish a "Risk Budget" to maintain long-term financial stability.
- Compare price-based and volatility-based protection signals to determine which methodology best filters out market noise.
- Implement a stock market drawdown indicator as part of a systematic, rules-based framework to ensure disciplined exits during high-risk periods.
- Understand the mathematical necessity of avoiding catastrophic losses to protect the geometric compounding of your retirement savings.
- Transition from emotional speculation to institutional-grade clarity using data-driven tools designed for capital preservation.
What is a Stock Market Drawdown Indicator?
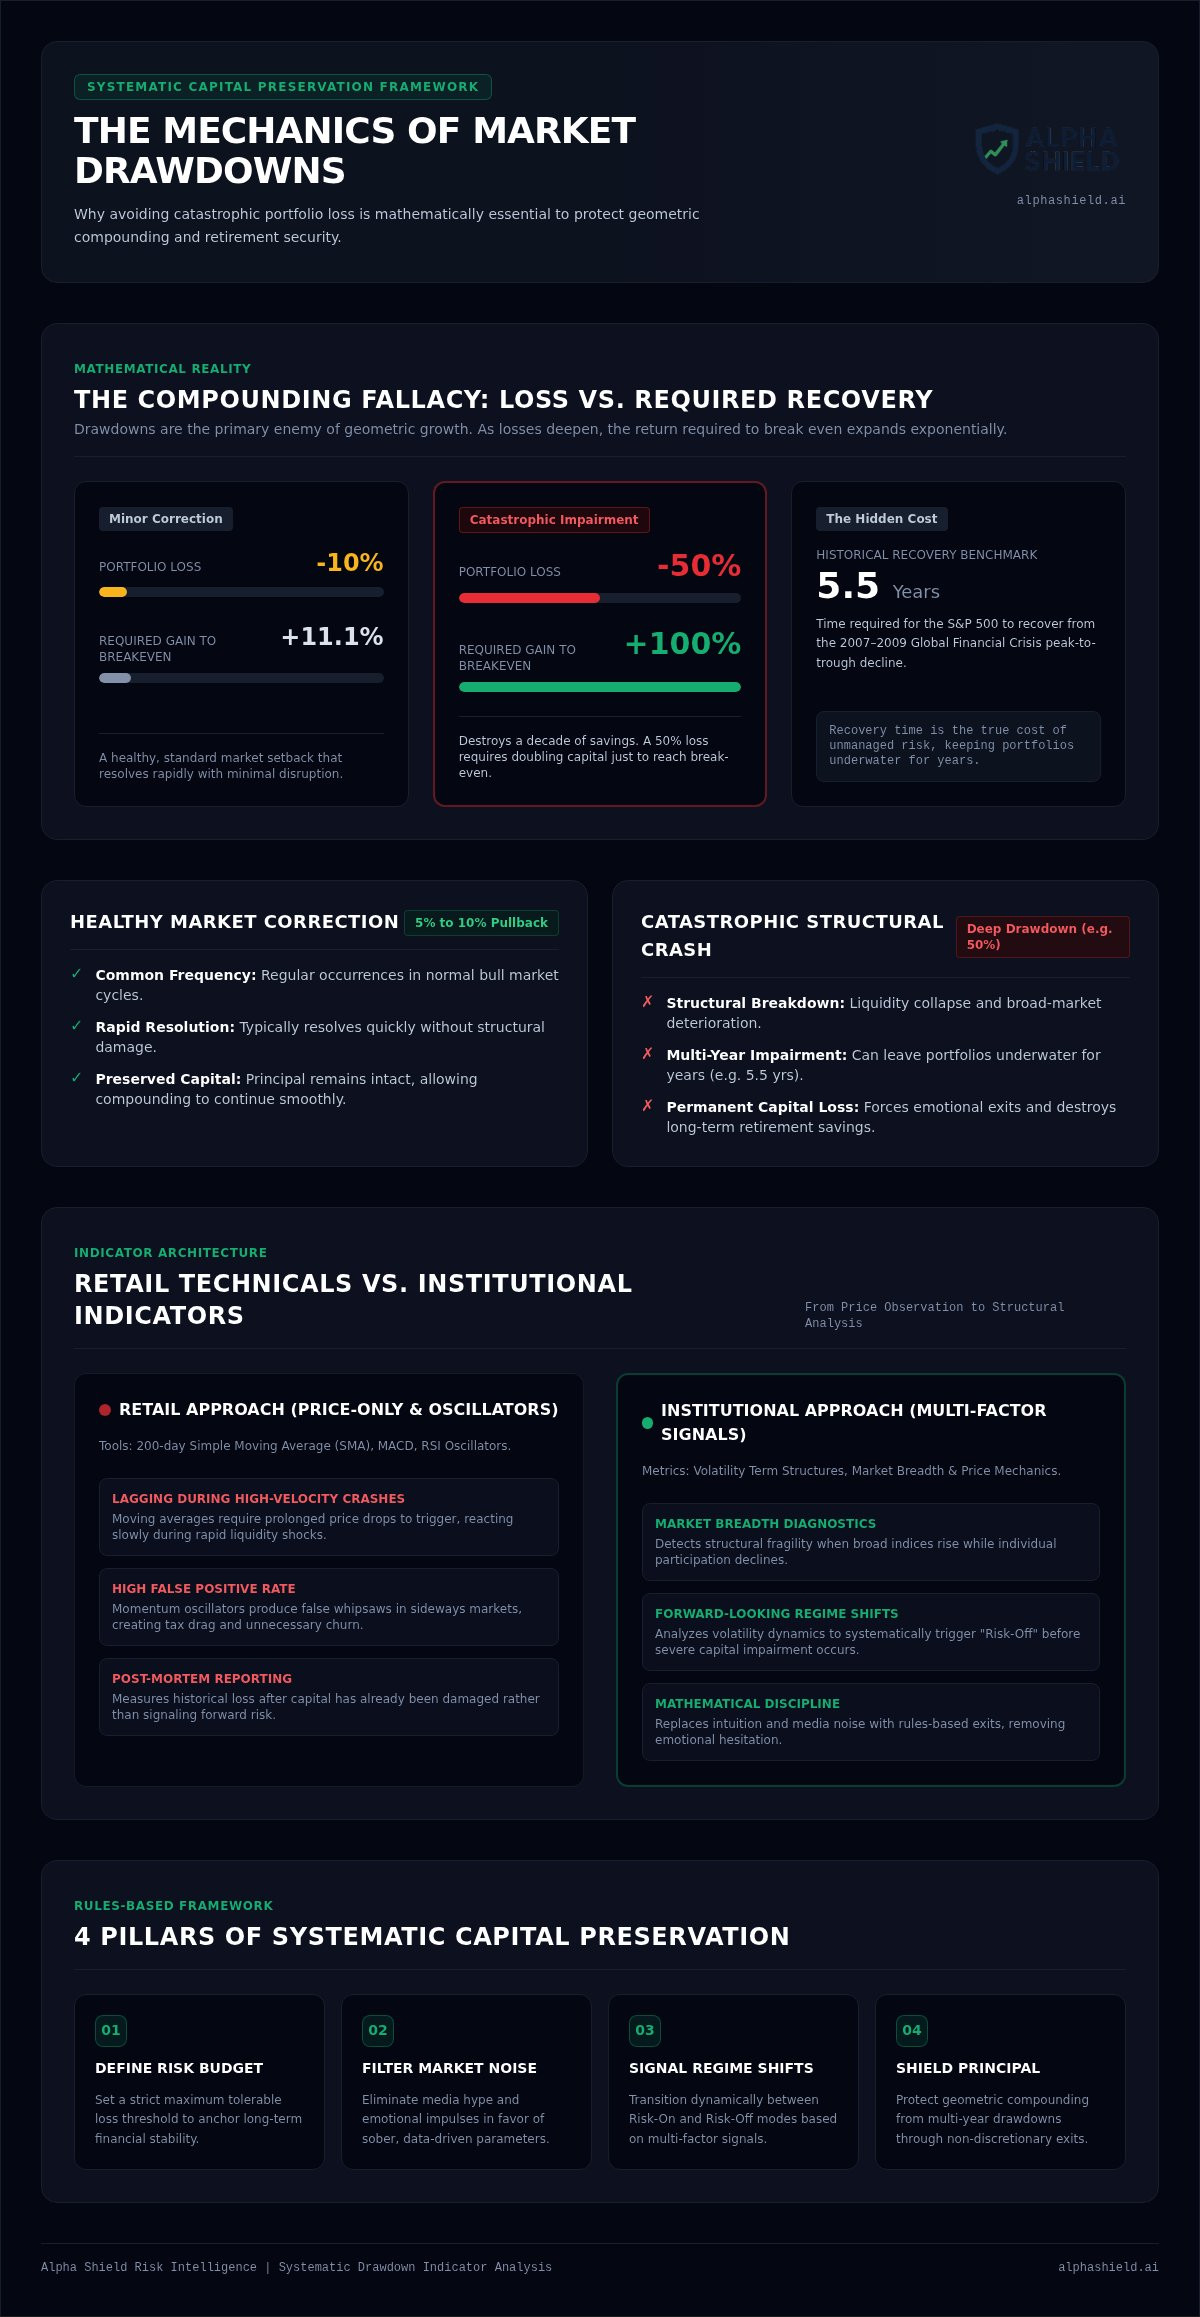
A stock market drawdown indicator is more than a metric of past performance. It's a systematic tool used to identify the probability of a peak-to-trough decline before capital is permanently impaired. While retail investors often focus on potential gains, institutional managers prioritize the preservation of principal. They understand that drawdowns are the primary enemy of geometric compounding. A 10 percent loss is a minor setback. A 50 percent loss is a catastrophic event that requires a 100 percent return just to reach breakeven. Protection is the priority.
Most retail tools only report historical drawdowns. They tell you how much you've already lost. A professional stock market drawdown indicator aims to be forward-looking. It analyzes market mechanics, such as volatility term structures, to signal when the regime has shifted from "Risk-On" to "Risk-Off." This distinction is critical. One approach is a post-mortem; the other is a protective shield. Institutional investors don't wait for the crash to conclude before acting. They use systematic filters to exit when the mathematical probability of a deep decline spikes.
The Mechanics of Market Drawdowns
Measuring risk begins with the distance from the most recent all-time high. This measurement, often called the maximum drawdown, reveals the true volatility of an asset. Healthy market corrections of 5 to 10 percent are common and often resolve quickly. Catastrophic crashes are different. They involve structural breakdowns that can leave portfolios underwater for years. For example, the S&P 500 took approximately 5.5 years to recover from the 2007-2009 Global Financial Crisis. Recovery time is the hidden cost of risk. A reliable indicator identifies these high-risk regimes early, allowing investors to move to defensive postures before the damage is done.
Capital Preservation vs. Speculation
Using a data-driven signal shifts the focus from speculation to mathematical certainty. It functions as the foundation of a rules based investing system. This approach removes the "noise" generated by financial media and emotional impulses. We don't rely on intuition or "gut feelings" about where the market is going. Instead, we use filters to determine when the environment is no longer favorable for equity exposure. This "anti-hype" communication is essential. It treats market volatility as a variable to be managed rather than an emotional crisis to be feared. By following a non-discretionary signal, you eliminate the hesitation that often leads to holding losing positions for too long. Clarity replaces chaos.
Types of Market Protection Signals: From Price to Volatility
Effective risk management requires a transition from observing price to analyzing structure. Most retail investors rely on price-based signals such as moving averages or trend-following indicators. These tools are useful for identifying long-term bear markets, but they often lag during rapid liquidity events. A 200-day simple moving average might protect capital during a multi-year decline like 2008, yet it remains slow to react during high-velocity crashes. Relying solely on price creates a delay that can result in significant capital impairment before an exit signal is generated.
A professional stock market drawdown indicator incorporates volatility-based metrics and market breadth to provide a more responsive filter. Breadth indicators measure how many individual stocks are participating in a rally. If the broad indices are rising while the majority of stocks are falling, the market structure is fragile. Combining price, volatility, and breadth creates a multi-factor approach that is far superior to any single chart pattern. This systematic rigor allows you to identify when the environment has become hostile. Understanding the relationship between market volatility and investment risk is the first step toward professional-grade protection.
The Limitations of Technical Indicators
Retail-grade scripts like the MACD or RSI are often insufficient for crash protection. These oscillators are designed to measure momentum, not structural risk. They frequently produce "false positives" during sideways markets, leading to unnecessary churn and tax drag. If you spend your time "indicator hunting," you're likely reacting to noise rather than signal. Systematic risk monitoring requires a shift away from these lagging tools toward a non-discretionary framework that prioritizes the avoidance of catastrophic errors.
Institutional Volatility Metrics
Institutional managers focus on the VIX term structure to identify high-risk periods. In a healthy market, longer-dated volatility futures trade higher than front-month contracts. When this relationship inverts, it signals that institutional demand for immediate protection has spiked. This shift is a leading indicator of potential drawdowns. A market regime is the underlying mathematical state of volatility and trend. By decoding these regimes, investors can move to cash or defensive assets before price action confirms the breakdown. Utilizing a market crash and drawdown tool can provide the clarity needed to navigate these complex institutional shifts without emotional bias.
The Compounding Fallacy: Why Avoiding Drawdowns is Mathematically Essential
Compounding is often called the eighth wonder of the world, but it only works if the principal remains intact. The "Math of Losses" reveals a brutal asymmetry that most investors ignore. If you lose 10 percent, you need an 11.1 percent gain to return to zero. If you lose 20 percent, you need a 25 percent gain. If you suffer a 50 percent drawdown, your portfolio must double simply to recover. This is the compounding fallacy. It's the reason a stock market drawdown indicator isn't just a luxury; it's a structural necessity for long-term wealth. Avoiding the "Big Loss" does more for your final balance than chasing the "Big Gain."
Passive advisors often preach "time in the market" as a universal solution. They suggest that staying invested through every crash is the only path to success. This narrative ignores the reality of multi-year recovery periods. The S&P 500 took over five years to recover from the 2008 crisis. For an investor near retirement, that time is an unrecoverable asset. Utilizing market crash defense strategies provides a rational alternative. It prioritizes capital preservation over the hope of a quick rebound. Systematic risk management is not about predicting the future. It's about responding to the present mathematical state of the market.
Comparing Passive vs. Protected Portfolios
Protected portfolios utilize systematic filters to exit high-risk regimes. This discipline significantly impacts retirement planning. The standard "4 percent rule" for withdrawals assumes a relatively stable sequence of returns. A major drawdown in the early years of retirement can trigger a "sequence of returns risk" that depletes a portfolio prematurely. By integrating professional portfolio risk management, you protect the asset base that generates your income. Capital preservation is the luxury of the disciplined investor. You don't need to be right about every move; you only need to be out during the catastrophic ones.
Removing the "Hero" Narrative
Many retail traders try to "pick the top" or "buy the dip" based on intuition. This is a speculative gamble. Institutional investors focus on the "fat tails" of market distribution. These are the rare, extreme events that cause the most damage. We don't aim to be heroes. We aim to be survivors. Protecting what you have already earned is more important than chasing the last 2 percent of a rally. A systematic stock market drawdown indicator removes the ego from the decision. Logic replaces emotion. If the signal says "Out," we exit. If it says "In," we participate. Consistency is the only path to long-term security.
How to Implement a Systematic Drawdown Strategy
Implementation requires a logical sequence. If you don't know your maximum tolerable loss, you can't build a wall around your capital. Systematic protection is a process, not a single event. It involves filtering out the noise and adhering to a non-discretionary framework. Institutional managers don't rely on luck; they rely on a repeatable protocol.
- Step 1: Define your "Risk Budget." Determine the exact percentage of capital you're willing to expose to market fluctuations.
- Step 2: Select a non-discretionary signal. A professional stock market drawdown indicator provides the objective data needed to override emotional impulses.
- Step 3: Establish a binary protocol. You must have a pre-defined rule for both exiting and re-entering the market to avoid hesitation.
- Step 4: Monitor market health. Use a centralized dashboard to track institutional volatility and breadth shifts in real-time.
Selecting Your Signal Source
Individual stock picks are irrelevant for drawdown protection. Diversification across equities doesn't protect you from systemic crashes. When the broad market fails, correlations tend to converge toward 1.0. You need a macro perspective. A stock market risk dashboard allows you to see the underlying mechanics of the global environment. This visibility prevents "analysis paralysis." By limiting your inputs to a few high-conviction metrics, you maintain the clarity required for decisive action. Unlike traditional stop-loss orders, which can be gapped over during overnight liquidity events, a regime-based indicator assesses market health before the breakdown occurs.
The Binary Logic of Protection
Systematic investing operates on binary logic. If the signal is "Green," the action is participation. If the signal is "Red," the action is protection. There's no room for "maybe" or "wait and see." This simplicity is a luxury for the disciplined investor. It eliminates the mental load of constant decision-making. When the crowd is driven by greed or fear, your system remains a rational anchor. You aren't trying to outsmart the market. You're simply following a battle-tested protocol that prioritizes capital preservation above all else. Discipline is the only bridge between a plan and a result.
Alpha Shield: Professional Risk Management for Long-Term Investors
The Alpha Shield signal functions as the ultimate stock market drawdown indicator for those who value clarity over complexity. It is the practical application of the institutional principles discussed in this guide. Our system decodes the VIX Futures Curve and curve-slope metrics in real-time. It transforms these complex data points into a single, actionable daily signal. This process filters out the noise of the financial media, providing a rational anchor in a volatile environment. We prioritize capital preservation because we understand the mathematical cost of recovery.
The Alpha Shield Dashboard provides a sober, institutional-grade view of global risk. It is designed for investors who have moved past the excitement of speculation and seek the stability of systematic rigor. Our methodology is built on 50 years of institutional experience. We have refined this rules-based approach since 2017 to ensure it remains a reliable filter against market chaos. We don't offer day-trading tools. We don't recommend shorting strategies. We don't provide individual stock picks. By explicitly stating what we do not do, we maintain the integrity of our core mission: protecting your long-term wealth from catastrophic errors.
Simplicity as a Professional Luxury
Professional achievement is often found in the reduction of data, not its accumulation. We reduce thousands of market variables into a binary "IN" or "OUT" instruction. This simplicity is a luxury for the disciplined investor. It removes the mental load of constant analysis and the emotional bias that leads to holding losing positions. Our "anti-hype" approach builds trust through transparency. We define the limits of our system clearly. We don't promise to predict every minor fluctuation; we promise to identify the high-risk regimes that threaten your principal. A partner who values honesty over sensationalism is essential for long-term security.
Taking the Next Step in Capital Preservation
The 2026 market environment requires a more sophisticated approach than simple "buy and hold" strategies. Passive portfolios are often left defenseless during rapid liquidity events. Joining Alpha Shield means joining a community of disciplined, results-oriented investors who prioritize the "math of losses" over speculative gains. You retain 100 percent control of your broker accounts while following a battle-tested philosophy. Peace of mind comes from knowing you have a systematic exit strategy. It's time to replace market anxiety with professional-grade clarity. Secure your portfolio with a stock market drawdown indicator that prioritizes your survival.
Securing Your Financial Future Through Systematic Discipline
Managing market risk is no longer a matter of intuition. It's a mathematical necessity. You've seen how the compounding fallacy can destroy years of progress in a single quarter. To survive high-risk regimes, you must transition from reactive speculation to proactive, rules-based protection. A professional stock market drawdown indicator provides the objective filter needed to separate institutional signals from retail noise. By prioritizing capital preservation, you ensure that your portfolio remains intact for the next growth cycle.
Alpha Shield offers a rational anchor in an increasingly volatile world. Our methodology is rooted in 50 plus years of institutional markets experience and has provided systematic crash protection since 2019. We don't rely on hype or complex trading scripts. We provide a data-driven philosophy that values transparency and results. It's time to replace market anxiety with a battle-tested strategy designed to protect what you've already earned.
Take the first step toward professional-grade risk management. Your long-term wealth depends on the discipline you implement today.
Frequently Asked Questions
What is a stock market drawdown indicator exactly?
A stock market drawdown indicator is a systematic metric designed to identify high-risk regimes before significant capital loss occurs. It functions as a forward-looking filter rather than a simple historical record of past declines. By analyzing institutional data like the VIX futures curve, the indicator signals when the probability of a market crash exceeds acceptable risk levels. This allows investors to move to defensive capital preservation strategies before their principal is permanently impaired.
How is a drawdown indicator different from a standard technical indicator?
Standard technical indicators like RSI or MACD typically lag price action and focus on short-term momentum. A drawdown indicator focuses on market structure and volatility regimes. It uses institutional metrics, such as market breadth and the VIX term structure, to identify structural breakdowns. This approach provides a more reliable signal for long-term capital preservation. It avoids the noise and false positives often associated with retail-grade trading scripts and speculative chart patterns.
Can a drawdown indicator predict a market crash before it happens?
These tools don't predict the future; they decode the current mathematical state of the market. When institutional demand for protection spikes, the indicator signals a regime shift from "Risk-On" to "Risk-Off." This process identifies periods where the probability of a catastrophic decline is statistically elevated. By responding to these data-driven signals, you can exit the market before a correction turns into a structural crash. It's about managing probabilities rather than making speculative guesses.
Why shouldn’t I just buy and hold through market downturns?
The math of losses makes passive buy-and-hold strategies dangerous for long-term wealth. A 50 percent drawdown requires a 100 percent return just to reach your previous break-even point. Recovery can take years, as seen during the 2008 financial crisis. Systematic risk management avoids these deep losses, allowing your portfolio to compound from a higher base. Protecting your principal base is the most efficient way to accelerate long-term capital growth and retirement security.
Is a drawdown indicator useful for a 401k or IRA account?
These signals are highly effective for retirement accounts where capital preservation is the primary goal. You can use the signal to shift between equity ETFs and defensive assets like T-bills or cash-equivalent funds within your 401k or IRA. This systematic approach protects the asset base that generates your future income. It eliminates the emotional stress of watching your retirement savings evaporate during a market crash. Consistency is essential for long-term compounding success.
How often should I check my drawdown signals?
Checking the signal once per day at the market close is the most effective frequency. Alpha Shield provides a daily regime signal that filters out intraday noise while capturing significant structural shifts. This cadence prevents over-trading and minimizes transaction costs. You don't need to monitor the market 24/7 or engage in day-trading. A single, disciplined check ensures you're aligned with the current risk environment without the mental load of constant decision-making.
Do drawdown indicators work in both bull and bear markets?
Yes. The indicator provides value by identifying the underlying regime regardless of the current trend. In bull markets, it confirms healthy conditions and keeps you invested with confidence. In bear markets, it identifies the high-risk periods that lead to catastrophic drawdowns. This binary logic ensures you participate in the majority of market gains while avoiding the most damaging declines. It functions as a rational anchor during both periods of greed and fear.
What is the most reliable volatility metric for detecting drawdowns?
The VIX futures curve term structure is widely considered the most reliable institutional metric. In healthy markets, the curve is in contango, meaning longer-dated volatility trades higher than front-month contracts. When this relationship inverts into backwardation, it signals imminent structural stress. Alpha Shield decodes these curve-slope metrics to provide a clear stock market drawdown indicator. This data-driven approach offers a more sophisticated warning sign than traditional price-based moving averages or financial news headlines.


