
What if the most valuable component of your portfolio isn't a specific stock, but a signal from a professional stock market risk dashboard that tells you when to walk away? The financial industry thrives on noise, yet your capital relies on clarity. You've likely felt the weight of a major drawdown or the exhaustion of sorting through conflicting headlines. It's a common struggle. Most portfolios are built for the upside, but few have a mechanical plan for the downside. You understand that emotional decisions lead to catastrophic errors. You want to replace guesswork with systematic rigor.
This guide explains how to transform complex volatility metrics into a singular, actionable signal. The Alpha Shield philosophy focuses on capital preservation rather than speculative excitement. Our approach subtracts the noise of financial media to reveal a clear path. We don't provide individual stock picks or day-trading tools. Instead, we offer a rational anchor. You'll discover how to utilize data-driven signals to protect your principal before a crash occurs. If the data signals danger, the system responds. If the environment is stable, you remain invested.
We'll examine the mechanics of institutional risk management and how to calibrate your strategy for 2026. This is your roadmap to wealth preservation without constant monitoring.
Key Takeaways
- Learn how a professional stock market risk dashboard filters macro noise into actionable signals for capital preservation.
- Understand why monitoring the VIX term structure provides a superior perspective on market health compared to standard volatility metrics.
- Identify the critical differences between retail "hype" indicators and institutional-grade tools built for tail-risk protection.
- Define your "Uncle Point" to establish a mechanical threshold for exiting the market during high-risk regimes.
- Implement a systematic signal developed by investment banking professionals to ensure long-term wealth preservation.
What is a Stock Market Risk Dashboard and Why is it Vital?
A professional stock market risk dashboard is not a simple ticker tape or a collection of news headlines. It's a visual monitoring system designed to aggregate complex macro data into binary risk signals. Most retail investors rely on descriptive data. They look at what is happening right now. Professional systems focus on prescriptive signals. They define what you should do next. This transition from "what" to "how" is the foundation of risk management principles. Effective use of a stock market risk dashboard requires a shift in perspective. You must stop looking for the next big winner and start looking for the next big risk.
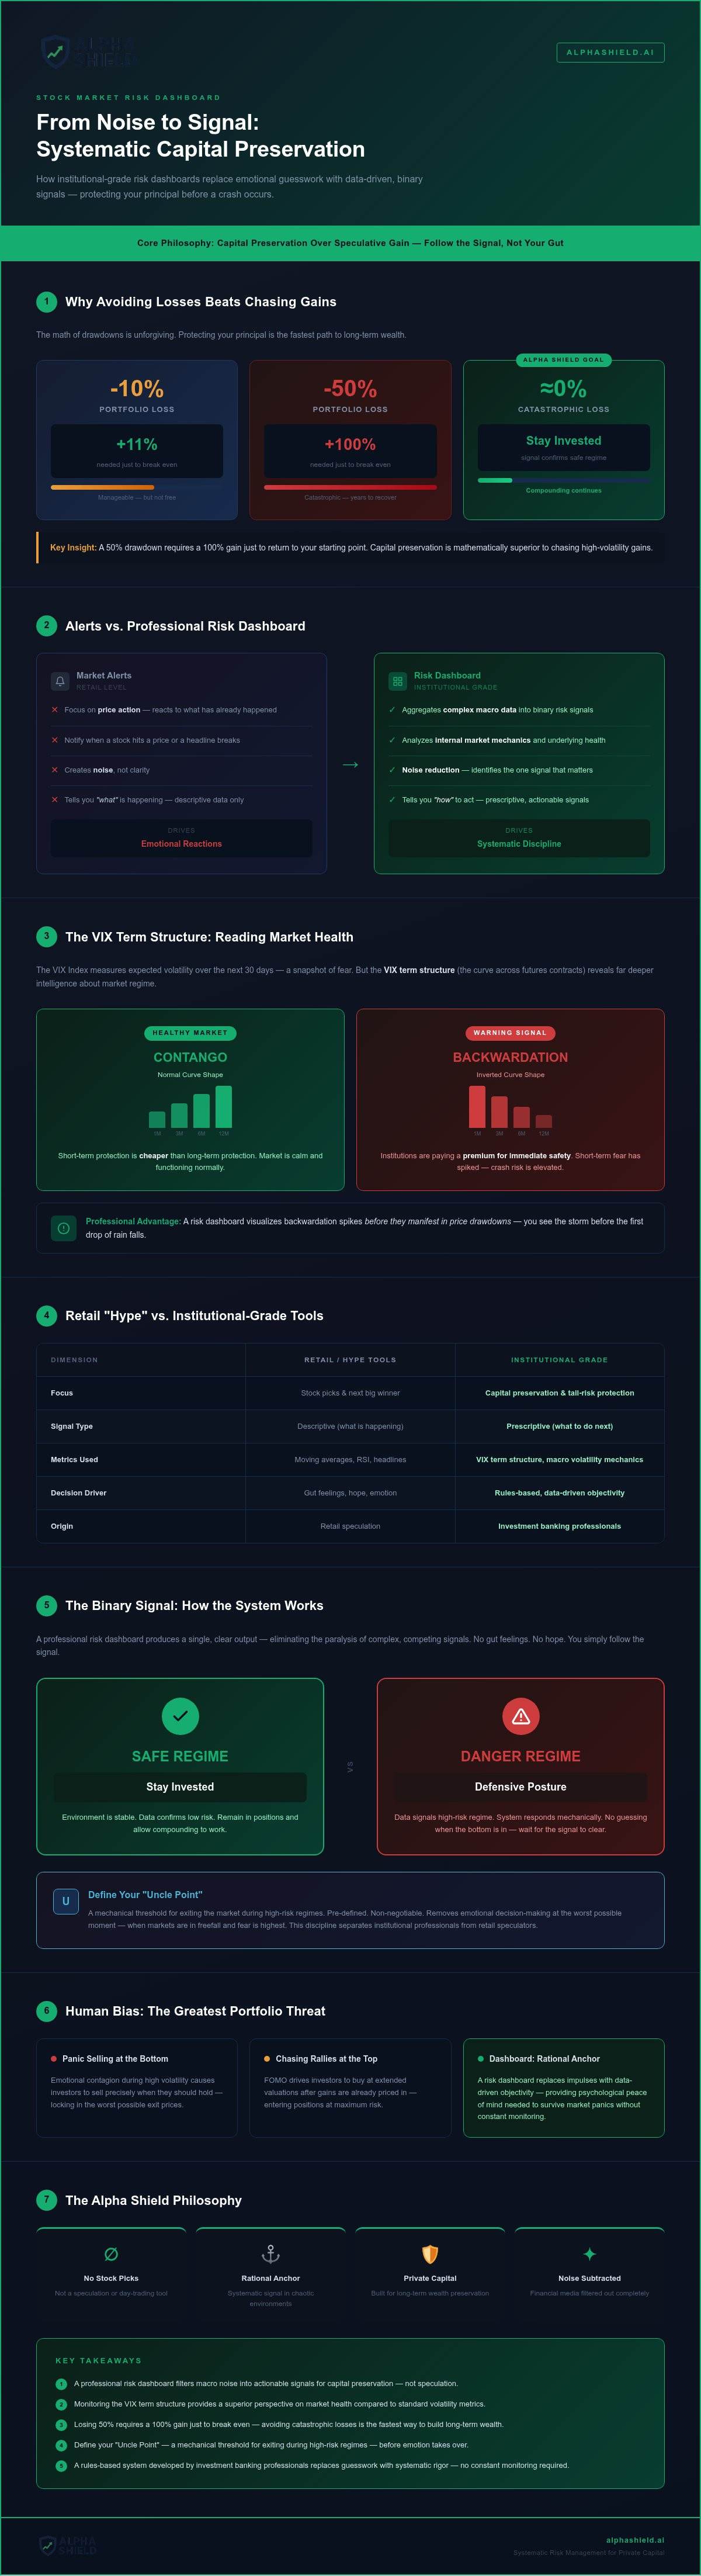
Human bias is the greatest threat to a portfolio. During periods of high volatility, emotional contagion often leads to panic selling at the bottom or chasing rallies at the top. A dashboard replaces these impulses with data-driven objectivity. It provides a rational anchor in a chaotic environment. When the data signals a high-risk regime, the system dictates a defensive posture. There is no room for "gut feelings" or "hope." You simply follow the signal. This discipline is what separates institutional professionals from retail speculators.
The Difference Between Market Alerts and Risk Dashboards
Alerts focus on price action. They notify you when a stock hits a certain level or when a headline breaks. This creates noise. Dashboards focus on underlying market health. They analyze the internal mechanics of the market to identify risk regimes. A professional interface prioritize noise reduction. It doesn't want to tell you everything. It wants to tell you the one thing that matters: is the current environment safe for your capital? Visualizing these regimes allows you to see the difference between a minor dip and a structural collapse.
Capital Preservation: The Core Objective
Capital preservation is mathematically superior to chasing high-volatility gains. The math of drawdowns is unforgiving. If your portfolio loses 10%, you need an 11% gain to break even. If you lose 50%, you need a 100% gain just to return to your starting point. Avoiding these catastrophic losses is the fastest way to build long-term wealth. By implementing market crash defense strategies, you protect your principal during turbulent periods. A systematic anchor provides the psychological peace of mind needed to survive market panics. You don't need to guess when the bottom is in. You wait for the dashboard to signal that the risk has subsided.
The Mechanics of Professional Risk Signals: Beyond Basic Technicals
Professional risk management requires looking beneath the surface of price action. While retail traders focus on moving averages or RSI, institutional systems analyze the internal mechanics of volatility. A professional stock market risk dashboard utilizes the VIX term structure to decode market stress. This is a shift from reactive monitoring to proactive calibration. It relies on data-driven objectivity rather than human intuition. By filtering out retail sentiment, you can focus on the variables that actually drive long-term capital preservation.
The VIX Index itself only measures expected volatility over the next 30 days. It's a snapshot of current fear. The VIX term structure tracks the relationship between different futures contracts. This curve provides a deeper look into investment risk management strategies used by professionals. It distinguishes between quiet volatility, which is a normal part of market function, and turbulent volatility, which often precedes a crash. Algorithms decode these mechanics to identify market regimes without the interference of human bias.
Decoding the VIX Futures Curve
The shape of the volatility curve reveals the true health of the market. In a healthy environment, the curve is in contango. This means short-term protection is cheaper than long-term protection. When the curve flips into backwardation, short-term fear has spiked. Institutions are paying a premium for immediate safety. This is a hidden warning sign. A professional stock market risk dashboard visualizes these spikes before they manifest in price drawdowns. It allows you to see the storm before the first drop of rain falls.
The Power of a Rules Based Investing System
Scaling discipline is impossible without a rules based investing system. Human psychology isn't designed for high-stress financial environments. We're wired to feel fear when we should be calm and greed when we should be cautious. A systematic approach provides binary signals. You know exactly when to be In and when to be Out. There's no room for discretionary gut feelings. Using a tool like Alpha Shield ensures your portfolio responds to data rather than headlines. It's about maintaining a rational anchor while others succumb to emotional contagion.
Evaluating Risk Management Software: Institutional Grade vs. Retail Tools
Retail software often prioritizes "hype" indicators. These tools emphasize short-term gains and speculative technical patterns that frequently lag the actual market movement. In contrast, an institutional-grade stock market risk dashboard focuses on tail-risk protection. It prioritizes the survival of the portfolio over the excitement of the trade. This alignment with SEC guidance on risk management and asset allocation ensures that the investor remains focused on long-term stability. Systematic rigor is required to filter out the noise of retail sentiment. It's about moving from a reactive state to a calibrated, proactive position.
More data points don't translate to better decisions. In fact, excessive information often leads to analysis paralysis or emotional hesitation. A professional tool uses extensive historical back-testing to validate its signals across multiple decades. It analyzes how the system performed during actual market structural shifts, such as the 2008 financial crisis or the 2020 pandemic. This rigor ensures the signal remains reliable when it matters most. If the logic doesn't hold up under extreme stress, it isn't institutional quality. Professional systems are designed to protect capital when the unexpected occurs.
Subtraction as a Professional Luxury
Institutional professionals treat simplicity as a luxury. They don't need a hundred charts to make a decision. They need clarity. The best dashboards filter thousands of data points into a single, actionable risk score. This avoids the trap of "over-fitting," where a strategy is tuned too specifically to one past cycle. If a system is too complex, it's fragile. If it's simple and rule-based, it's robust. By subtracting the noise, you gain the ability to act with decisiveness during periods of market chaos. Clarity is the ultimate competitive advantage.
Reliability and Stability in Volatile Environments
A reliable signal must have navigated the 2020 flash crash and the 2022 bear market with absolute discipline. A sober, no-nonsense tone is a hallmark of institutional quality. It doesn't use aggressive urgency or sensationalism to drive engagement. Instead, it acts as a rational anchor when the broader market is driven by greed or panic. This detachment allows for logical execution during periods of high emotional stress. You aren't guessing the next move. You're following a battle-tested roadmap designed for consistency. Stability is built on a foundation of data, not headlines.
How to Integrate a Risk Dashboard into Your Investment Strategy
Integration requires a shift from passive observation to active calibration. A stock market risk dashboard provides the data, but you must provide the discipline to execute. This process begins with a clear definition of your risk tolerance. You don't wait for a crash to decide your plan. You establish the rules while the market is calm.
Step 1: Define your 'Uncle Point'. This is the maximum drawdown your portfolio can sustain before your long-term goals are compromised. Once this threshold is set, it becomes a hard limit. It's the point where you stop hoping and start protecting.
Step 2: Calibrate your portfolio based on the dashboard’s primary market signal. If the signal indicates a low-risk regime, you maintain your exposure. If the signal shifts to high-risk, you reduce exposure. This is a binary process with no room for middle ground.
Step 3: Execute exits and entries with zero ambiguity. Professionalism means following the rules even when your intuition disagrees. If the system says exit, you exit. You don't wait for "one more day" of gains. You prioritize the signal over your ego.
Step 4: Monitor market health daily. This routine maintains emotional detachment. You aren't checking prices to see how much you've made. You're checking the signal to see if the environment has changed. This daily habit reinforces your commitment to systematic rigor.
Managing Long-Term Capital Preservation
Protecting retirement wealth requires a focus on major cycle shifts. A stock market risk dashboard is not designed for day-trading. It's built to safeguard 401ks and long-term accounts from catastrophic crashes. We use an 'if-then' framework to simplify these complex decisions. If the signal turns red, then you shift to cash or defensive assets. If the signal remains green, then you stay the course. This systematic approach ensures you aren't caught in a 30% or 40% drawdown that takes years to recover. You preserve your principal to participate in the next cycle.
Removing the Mental Load of Decision-Making
Decision fatigue is a significant burden for the private investor. Constant headlines create a state of perpetual anxiety. A systematic dashboard reduces this mental load by providing a singular instruction. The routine is simple. You check the signal. You follow the rule. This methodical pace prevents the exhaustion that comes from trying to outguess the market. By outsourcing the analytical heavy lifting to a data-driven engine, you gain the luxury of clarity. You focus on your life while the system monitors the risk.
The Alpha Shield Dashboard: Systematic Protection for Private Capital
The Alpha Shield Dashboard is not a retail trading app. It's an insider's tool designed for the specific purpose of capital preservation. Built by former investment bankers with over 50 years of combined experience, this system brings institutional rigor to the private investor. It provides a professional stock market risk dashboard that prioritizes data-driven objectivity over speculative excitement. We focus on the variables that matter most to your principal. Our system development started in 2017 with a singular goal: to help you avoid the "Big One".
Clarity is achieved through subtraction. We don't provide individual stock recommendations. We don't offer shorting strategies or day-trading tools. These activities introduce unnecessary noise and emotional stress. Instead, the Alpha Shield signal acts as a dedicated market health indicator. It decodes complex volatility metrics into a binary instruction. If the environment is stable, the signal is green. If the risk is elevated, the signal turns red. It's a rational anchor in a volatile world.
Visualizing Market Health with Clarity
The interface is professional, disciplined, and sober. It deliberately avoids the flashing lights and urgent alerts common in retail platforms. You'll find real-time monitoring of market crash and drawdown indicators. Our subtraction technique filters out thousands of irrelevant data points to reveal the underlying truth of market regimes. This provides the ultimate investment clarity. You aren't distracted by headlines. You're focused on the mechanical health of the system. This is how institutional professionals navigate global markets.
Join the Disciplined Few
Transitioning from a reactive trader to a systematic strategist requires a change in mindset. You must value consistency over short-term gambles. Alpha Shield serves as your protective guide through periods of market chaos. We provide the roadmap, but you provide the discipline to follow it. This is not about market intuition. It's about rule-based execution. By using a professional stock market risk dashboard, you remove the burden of emotional decision-making. You join a group of investors who prioritize long-term security. Your next step is to subscribe to the Alpha Shield Market Signal and Dashboard. Secure your capital today.
Securing Your Financial Future Through Systematic Discipline
Navigating the complexity of the 2026 market requires more than just optimism. It demands a mechanical approach to risk. You've learned that a professional stock market risk dashboard serves as a rational anchor by converting volatility metrics into actionable signals. By focusing on capital preservation rather than speculative gains, you avoid the mathematical trap of large drawdowns. This is the fundamental difference between a reactive trader and a disciplined strategist.
Alpha Shield was founded by former investment bankers who understand the inner workings of global markets. Since 2017, we've developed systematic risk signals focused exclusively on protecting your principal from catastrophic errors. We don't offer hype, shorting strategies, or individual stock picks. We offer the clarity of a battle-tested system designed for reliability. Implementing an "if-then" logic removes the mental load of decision-making and ensures you stay focused on your long-term objectives.
Transitioning to a rules-based strategy is the most significant step you can take for your long-term wealth. You now have the roadmap to protect your capital with confidence and professional rigor.
Frequently Asked Questions
What is the most reliable indicator on a stock market risk dashboard?
The VIX term structure is widely considered the most reliable indicator on a professional stock market risk dashboard. While the standard VIX index only reflects current fear, the term structure analyzes the relationship between different futures contracts. If the curve shifts from contango to backwardation, it signals that institutions are paying a premium for immediate safety. This structural shift often precedes significant market drawdowns. Monitoring these mechanics provides a deeper level of insight than price action alone.
Can a risk dashboard really predict a market crash?
A dashboard doesn't predict the future, but it identifies high-risk regimes where a crash is statistically more likely. It functions as a weather station for financial markets. If the data indicates a turbulent volatility environment, the risk of a catastrophic event increases. The goal is to identify these dangerous periods so you can move to a defensive posture. You don't need to predict a crash to protect your capital from one.
How often should I check my market risk dashboard?
You should check your dashboard once daily to maintain a disciplined routine. This interval is sufficient for capturing major cycle shifts without succumbing to the stress of intraday fluctuations. Professional wealth management is a methodical process, not a high-frequency activity. Checking the signal at the same time each day reinforces your commitment to the system. It ensures you are aware of regime changes while avoiding the noise of short-term price movements.
Is a risk dashboard suitable for long-term retirement investors?
Yes, a stock market risk dashboard is essential for retirement investors who prioritize long-term capital preservation. Protecting a 401k or IRA from a 30% or 40% drawdown is critical because large losses take years to recover. The system helps you exit during high-risk regimes and re-enter when conditions stabilize. This systematic protection ensures that your principal remains intact for your eventual retirement needs. It provides a rational anchor for long-term wealth.
What is the difference between a risk dashboard and a standard trading platform?
Standard trading platforms provide descriptive data, such as price charts and news feeds, which often create information overload. A professional risk dashboard provides prescriptive signals that tell you exactly what to do. It subtracts the noise of the financial world to reveal a singular, actionable market health signal. While trading platforms focus on execution and "hype" indicators, a dashboard focuses on risk regimes and the preservation of your capital.
Do I need technical analysis skills to use the Alpha Shield Dashboard?
You don't need advanced technical analysis skills to utilize the Alpha Shield Dashboard effectively. Our system is designed to decode complex volatility metrics and present them as a clear, binary signal. We do the analytical heavy lifting behind the scenes. Your role is to follow the rule-based instructions provided by the system. This simplicity allows you to manage your portfolio with institutional rigor without needing years of specialized training or market experience.
How does a systematic risk signal help with emotional investing?
A systematic risk signal removes the mental load of decision-making by replacing intuition with objective data. Emotional investing often leads to buying at the peak and selling during a panic. By following a rules-based system, you treat fear and greed as variables to be managed rather than experiences to be shared. If the signal is red, you shift to defense. This binary framework prevents the hesitation and bias that typically destroy private portfolios.
What data sources does a professional risk dashboard typically use?
Professional dashboards utilize a combination of volatility metrics, macro data, and the VIX term structure. These sources provide a comprehensive view of market mechanics and institutional positioning. By analyzing the relationship between different futures contracts, the system can identify structural shifts in market health. We prioritize high-quality, data-driven inputs that have been historically back-tested. This ensures the signal remains reliable during periods of extreme stress and avoids the trap of lagging retail indicators.


