
What if the best portfolio risk management software is the tool with the fewest dashboards? More screens don’t automatically lead to better risk decisions. Tools measure different things, and alerts can add noise when there’s no clear process for acting on them. Monitoring risk can inform a decision, but it can’t guarantee protection from losses.
It’s reasonable to want one tool that makes changing market conditions easier to interpret. Compare software by the decision it supports, not by the breadth of its features. This guide explains how to assess a tool’s purpose, signals, workflow, and limitations so you can judge what it contributes to your investment process.
You’ll also learn how to distinguish portfolio analytics from market-risk monitoring, set a disciplined response to alerts, and use a signal as an input rather than a substitute for judgment. Alpha Shield Market Signal and its dashboard are designed for focused market-risk monitoring, not as an all-purpose portfolio analytics suite. The aim is to clarify what a tool can help you see and what remains your decision.
Key Takeaways
- Start with the risk decision you need to support, then compare portfolio risk management software by its actual job rather than its feature count.
- Separate portfolio exposure analysis, market-risk signals, and execution tools so you know what each output can and cannot tell you.
- Assess how a tool turns inputs into indicators, and prioritize clear methodology and consistent interpretation over visual complexity.
- Build alerts into a defined review process to reduce noise and make responses more disciplined.
- Consider Alpha Shield Market Signal and its dashboard as a focused source of market-risk context within an existing investment process.
What portfolio risk management software does, and what it does not do
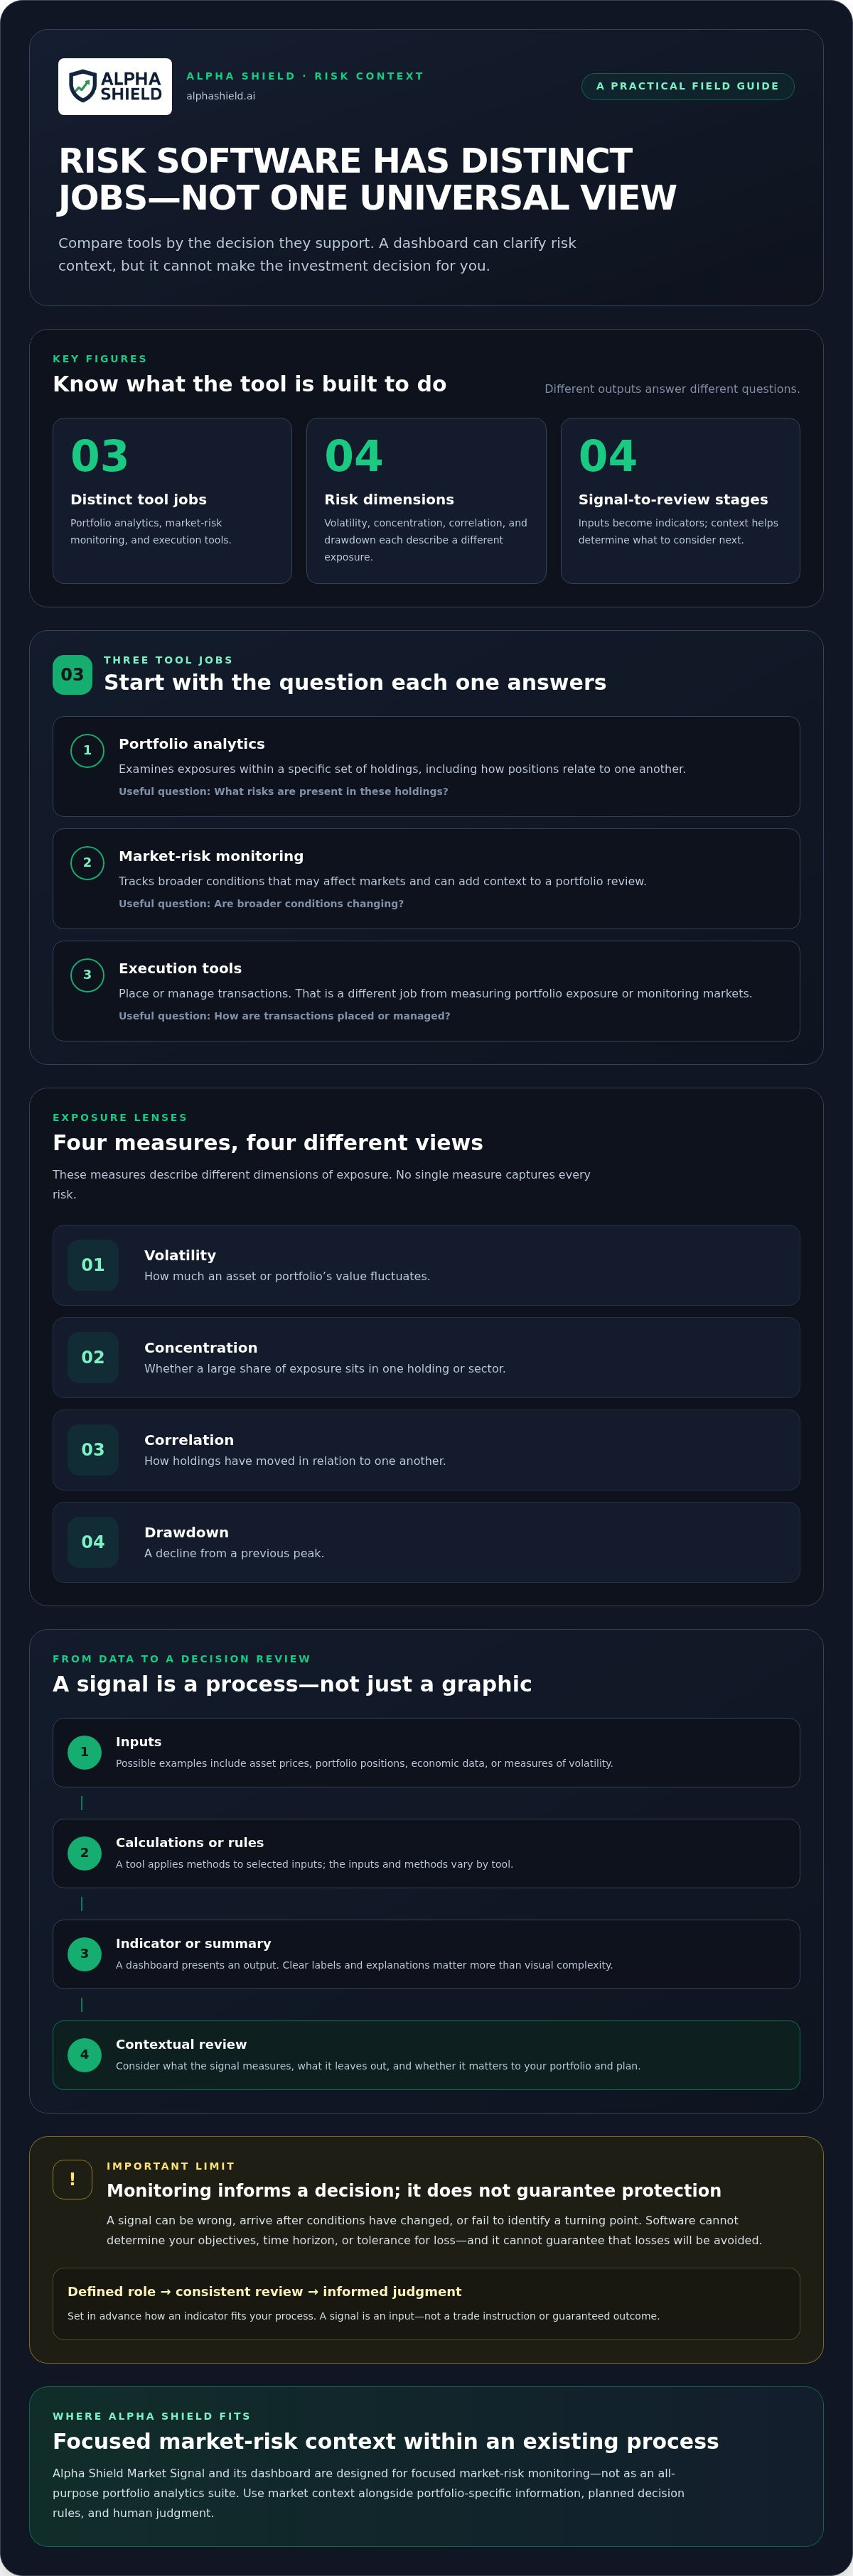
Portfolio risk management software helps investors measure, monitor, or respond to investment risk. The category is broad, and its tools don’t all solve the same problem. Portfolio analytics examine exposures within a specific set of holdings. Market-risk monitoring tracks broader conditions that may affect markets. Execution tools place or manage transactions. A dashboard or alert can inform a decision, but it isn’t itself an investment decision.
A useful definition: Risk monitoring helps investors observe and interpret potential exposure. It does not eliminate uncertainty or guarantee against losses.
This distinction matters because a portfolio can have vulnerabilities that a broad market indicator won’t describe, while portfolio analysis may not explain changing market conditions. The principles behind diversification and risk-return trade-offs are commonly associated with Modern Portfolio Theory. Software can make selected risks more visible, but what it measures and covers depends on the tool.
Which portfolio risks can software help investors monitor?
Some platforms assess volatility, or how much an asset or portfolio’s value fluctuates. Others show concentration, such as a large share of exposure in one holding or sector, or estimate correlation, which describes how holdings have moved in relation to one another. A drawdown view tracks a decline from a previous peak. These measures describe different dimensions of exposure. No single measure captures every risk.
Portfolio-specific exposure concerns the holdings and how they relate to one another. Market-wide monitoring instead looks for broader conditions that may signal a higher-risk period. A market signal can add context, but it doesn’t tell an investor exactly how a particular portfolio will behave.
What software cannot decide or guarantee for an investor
Analytics can show a measurement or flag a condition. They can’t determine an investor’s objectives, time horizon, or tolerance for loss. Those factors guide how information is interpreted and what response, if any, fits the investor’s plan.
A signal can be wrong, arrive after conditions have changed, or fail to identify a turning point. It cannot guarantee that losses will be avoided. Treat software as one input in a complete investment process, alongside portfolio context, planned decision rules, and human judgment. If an alert has no defined role, it may add noise rather than clarity.
How portfolio risk management software turns data into useful signals
A useful signal comes from a process, not simply a graphic on a screen. Portfolio risk management software may take market or portfolio inputs, apply calculations or rules, present an indicator, and give the user context for deciding what to do next. Inputs and methods vary by tool. For example, a portfolio analytics system might use holdings and weights to assess exposures, while a market signal may summarize broader market conditions. Their outputs answer different questions.
Inputs, indicators, and dashboard interpretation
As general examples, a tool might process asset prices, portfolio positions, economic data, or measures of volatility. These are possible inputs, not a description of any specific product’s data sources. Calculations convert selected inputs into indicators or summaries. A dashboard can make those outputs easier to scan, but clear labels and explanations matter more than visual complexity. Users need to understand what an indicator represents, what it leaves out, and how it relates to a decision.
Before relying on an output, look for a clear account of the methodology and its limits. An attractive chart won’t tell you whether a signal reflects a portfolio’s specific exposure or a broader market condition. Don’t assume a tool uses a particular indicator, calculation method, or update schedule unless that information is stated for that tool.
Why rules and context matter when signals change
A predefined process can help you respond consistently rather than react to each headline. For example, if a market signal changes, review what it measures, then consider whether that information is relevant to your portfolio and existing plan. The signal informs the review. It doesn’t dictate a trade or determine the right response.
This is where a systematic approach can help. Decide in advance what role an indicator plays, how you’ll review it, and which broader considerations shape any action. The Financial Stability Board’s discussion of an effective risk appetite framework offers useful context on connecting limits and oversight to risk decisions. For individual investors, the practical principle is similar: signals are easier to use when their place in a decision process is defined. A systematic risk mitigation framework can help structure that process.
A signal is an input to a decision, not a guaranteed outcome: it can organize information and prompt a review, but it cannot ensure a gain, prevent a loss, or identify every turning point. To see how a focused market-risk input can fit into an existing process, explore the Alpha Shield Market Signal.
Portfolio analytics vs. market signals: compare software by its job
Tools described as portfolio risk management software can serve very different purposes. Compare the decision each tool supports, not just the number of charts or metrics on its dashboard. Portfolio analytics focus on holdings. Market-risk dashboards summarize broader conditions. A market signal can flag potentially higher-risk periods. Execution tools, by contrast, support the placement or management of transactions.
| Category | Primary job | Typical output | User decision | Key limitation |
|---|---|---|---|---|
| Portfolio analytics | Assess holdings and portfolio exposure | Exposure breakdowns or portfolio-level metrics | Where might the portfolio be concentrated or sensitive? | May not indicate broader market conditions or prescribe a response |
| Market-risk dashboard | Summarize wider market conditions | Market-health indicators or risk summaries | Does the market context merit a closer review? | May not reflect an individual portfolio’s holdings |
| Market signal | Apply a systematic indicator to market conditions | A signal or status to interpret | Should this input prompt a review under my process? | Cannot guarantee outcomes or determine the right action |
| Execution tool | Support transaction activity | Order entry or transaction controls | How should an approved transaction be carried out? | Does not replace the analysis or judgment behind the decision |
Portfolio analytics: measure the holdings
This category may examine positions, weights, exposures, or other portfolio-level measures. It’s most relevant when the question concerns the holdings, such as whether too much of a portfolio is concentrated in one area. A broad market indicator answers a different question. It can provide context about market conditions, but it doesn’t show by itself how a particular set of holdings is exposed.
Market signals: interpret broader conditions
Systematic market signals are intended to highlight conditions that may warrant attention, including potentially higher-risk periods. Alpha Shield Market Signal and its associated dashboard fit this focused market-monitoring category. They are not stock-selection or trade-execution tools, and a signal remains an input for the investor to interpret within an existing process.
For a closer look at what volatility-related warnings can and can’t indicate, read this market volatility warning system guide. The distinction is practical: use portfolio analytics to examine the portfolio, market signals to assess broader context, and execution tools to carry out decisions made through the investor’s process. One category doesn’t automatically replace another.
How to evaluate portfolio risk management software for your process
Start with the decision, not the demo. The right portfolio risk management software should provide information that fits a defined need, such as assessing portfolio exposures or monitoring broader market conditions. A clean interface matters only if the underlying output is relevant, understandable, and usable within your investment process.
A practical checklist for comparing software
- Define the job. Decide whether you need portfolio measurement, market monitoring, or transaction execution. These functions address different questions, so the tool’s category should match the decision you want to support.
- Assess the methodology. Look for a clear explanation of what the tool measures and how it turns inputs into outputs. If the method is difficult to understand, it may be harder to interpret changes consistently.
- Test the output against your decision. Can you explain what a signal or metric means and what response it might prompt under your existing rules? If an alert has no defined place in your process, it may create activity without adding clarity.
- Review workflow fit and limitations. Consider whether the tool’s outputs fit naturally into your regular review process. Read its stated limits, and distinguish documented historical observations from evidence of future results. Past patterns don’t establish that the same signal will perform the same way in different conditions.
Match the tool to your investment horizon and workflow
Long-term investors may need structured context for reviewing risk, not frequent prompts that encourage short-term reactions. A market indicator can serve as a review trigger: if it changes, examine what it measures, consider its relevance to your plan, and decide whether your established rules call for action. If it doesn’t change, that alone doesn’t prove the portfolio is risk-free.
Keep the tool’s role narrow and explicit. For broader approaches to managing portfolio risk, see these defensive investing strategies. If your process also considers shifts in market conditions, this guide to market regime identification tools offers related context. The purpose isn’t to collect more signals. It’s to make each useful input accountable to a decision, while leaving room for uncertainty and investor judgment.
Where Alpha Shield fits in a portfolio risk management software stack
Alpha Shield is a focused market-risk signal and dashboard for monitoring market health and identifying higher-risk periods. It adds systematic market context to an investor’s existing process, particularly for those focused on long-term capital preservation. Its role is specific: provide a signal to consider, not a complete set of portfolio analytics or an instruction to trade.
When a focused market signal may fit, and when it may not
A market signal may be relevant if your process includes reviewing broader market conditions alongside your investment objectives and portfolio information. For example, a change in market-risk context could prompt a planned review. It doesn’t, by itself, show how your individual holdings are exposed or determine what action suits your circumstances.
Alpha Shield isn’t a replacement for portfolio-specific analytics or your judgment. It doesn’t provide day-trading tools, shorting strategies, or individual stock recommendations. Nor can a signal guarantee that losses will be avoided or identify every turning point. If your primary need is detailed analysis of individual holdings or transaction execution, a focused market signal serves a different purpose.
Explore the Alpha Shield Market Signal and dashboard
The Alpha Shield Market Signal is paired with a dedicated dashboard for monitoring market health and identifying higher-risk periods. The service provides systematic context that investors can consider within their own decision process. A signal can inform a review, but it doesn’t replace the plan, portfolio analysis, or judgment behind an investment decision.
Alpha Shield’s system development began in 2017, and the service launched in 2019. Its founders bring more than 50 years of combined investment banking and global markets experience. That background provides context for the service’s development; it isn’t evidence of future investment results or a guarantee of protection. In a portfolio risk management software stack, Alpha Shield is best understood by its defined function: market-risk monitoring through a signal and dashboard, rather than all-purpose portfolio measurement or execution.
Choose the tool that supports your next risk decision
The right portfolio risk management software isn’t necessarily the platform with the most features. Start with the decision you need to support, then assess whether the tool’s signals are clear, its methodology is understandable, and its limitations are explicit. Portfolio analytics, market monitoring, and execution tools serve different roles. A signal can add context, but it can’t guarantee protection or replace your investment judgment.
Alpha Shield focuses on systematic market-risk context for investors considering long-term capital preservation. Its dedicated dashboard accompanies the market signal. Development began in 2017, and Alpha Shield launched in 2019. The founders bring more than 50 years of combined investment banking and global markets experience. This provides background on the team, not a promise of investment results.
Keep your process disciplined: define what information you need, decide how it will inform a review, and avoid treating any indicator as certainty. A focused tool can help bring structure to that process.
Explore Alpha Shield Market Signal to add focused market-risk context to your investment review process.
Frequently Asked Questions
What is portfolio risk management software?
Portfolio risk management software helps investors measure, monitor, or interpret investment risks. Some tools analyze holdings and exposures, while others track broader market conditions. Execution tools support transactions and serve a different purpose. For example, portfolio analytics may show whether holdings are concentrated, while a market signal may highlight changing market risk. Software supports decisions, but it can’t guarantee protection, returns, or avoidance of losses. Match its actual function to the decision you need to make.
How do I choose portfolio risk management software?
Start by identifying the decision the software should support: measuring portfolio exposures, monitoring market conditions, or executing transactions. Then assess whether its methodology is explained, its outputs are understandable, and its workflow fits your investment process. Review stated limitations and performance claims carefully. Historical results describe past observations, not assured future outcomes. Choose portfolio risk management software for the job it does, rather than the number of dashboard features or alerts it offers.
Can portfolio risk management software prevent investment losses?
No. Software can’t reliably prevent all investment losses or remove market risk. Analytics and signals can help you monitor selected conditions and apply a consistent decision process, but outcomes remain uncertain. Tools also vary in what they measure: a market signal may indicate broader risk conditions without showing how your specific holdings are exposed. Interpret each output in light of your objectives and broader investment plan, and don’t treat an alert as a guarantee.
What is the difference between portfolio analytics and a market-risk signal?
Portfolio analytics generally examine holdings, exposures, or other portfolio-level measures. A market-risk signal focuses on broader market conditions and may help identify periods that warrant closer attention. These tools can provide complementary information, but they aren’t interchangeable. A market signal doesn’t necessarily analyze your individual holdings, and portfolio analytics may not describe wider market conditions. Check what a specific product measures before assuming its dashboard covers both.
Is portfolio risk management software suitable for long-term investors?
It can be relevant if it supports your investment process without encouraging unnecessary trading. Portfolio analytics may help you review exposures, while a systematic market signal can add broader risk context. Neither determines your objectives or guarantees a better result. Consider whether the tool’s outputs, review cadence, and stated limitations fit your approach. A useful tool should inform a planned review, not push you into reacting to every market movement.
Does Alpha Shield provide stock picks or trading instructions?
No. Alpha Shield focuses on a systematic market signal and dedicated dashboard for monitoring market health and identifying higher-risk periods. It doesn’t provide day-trading tools, shorting strategies, or individual stock recommendations. Its role is to provide market-risk context for an investor’s existing process, not to select securities or dictate a trade. The signal can inform your judgment, but it can’t guarantee a particular action or investment outcome.
What should I compare in a market-risk dashboard?
Compare what its indicators are intended to show, how the outputs are explained, how they fit your decision workflow, and what limitations are disclosed. Check whether it monitors individual portfolio exposures or broader market conditions; those are distinct functions. A clear interface can make information easier to review, but it doesn’t establish predictive accuracy. Before relying on technical or performance claims, look for clear documentation and distinguish historical observations from future expectations.


