
Market regime identification tools organize market data into a view of current conditions, but they do not know what happens next. That distinction matters when moving averages, volatility measures, and other indicators point in different directions. A classification can help describe the environment; it is not a forecast or a guarantee.
If market indicators are difficult to reconcile, start by asking what each one measures and what its output is meant to support. This guide explains common approaches to classifying regimes, from traditional indicators to statistical models, and shows how to compare a tool’s inputs, transparency, timeframe, and purpose.
Regime information can support long-term risk monitoring without turning a signal into certainty. Alpha Shield’s market signal and dashboard are designed to provide systematic context for monitoring market health and portfolio risk, not to predict every turning point. The goal is a clearer process, not perfect timing.
Key Takeaways
- Use market regime identification tools to organize conditions such as trend, volatility, and liquidity into a clearer risk picture.
- Trace a tool’s inputs and classification method so you understand what its output represents.
- Compare tools by timeframe, transparency, output, and intended use. A charting display and a systematic signal serve different purposes.
- Before relying on a regime label, define what you want to monitor, review how the label was produced, and consider it alongside your portfolio context.
- Treat regime information as one input to long-term risk management, not an automatic instruction to trade or change allocation.
What Market Regime Identification Tools Actually Identify
Markets move through changing combinations of direction, volatility, and liquidity. A market regime is a broad description of those conditions over a defined period, not a verdict about what the market will do next. Market regime identification tools group observed data into categories so investors can interpret the environment more consistently.
Regime identification classifies patterns in current or historical market data; market prediction estimates what may happen next. A classification can provide context, but it cannot make the future certain.
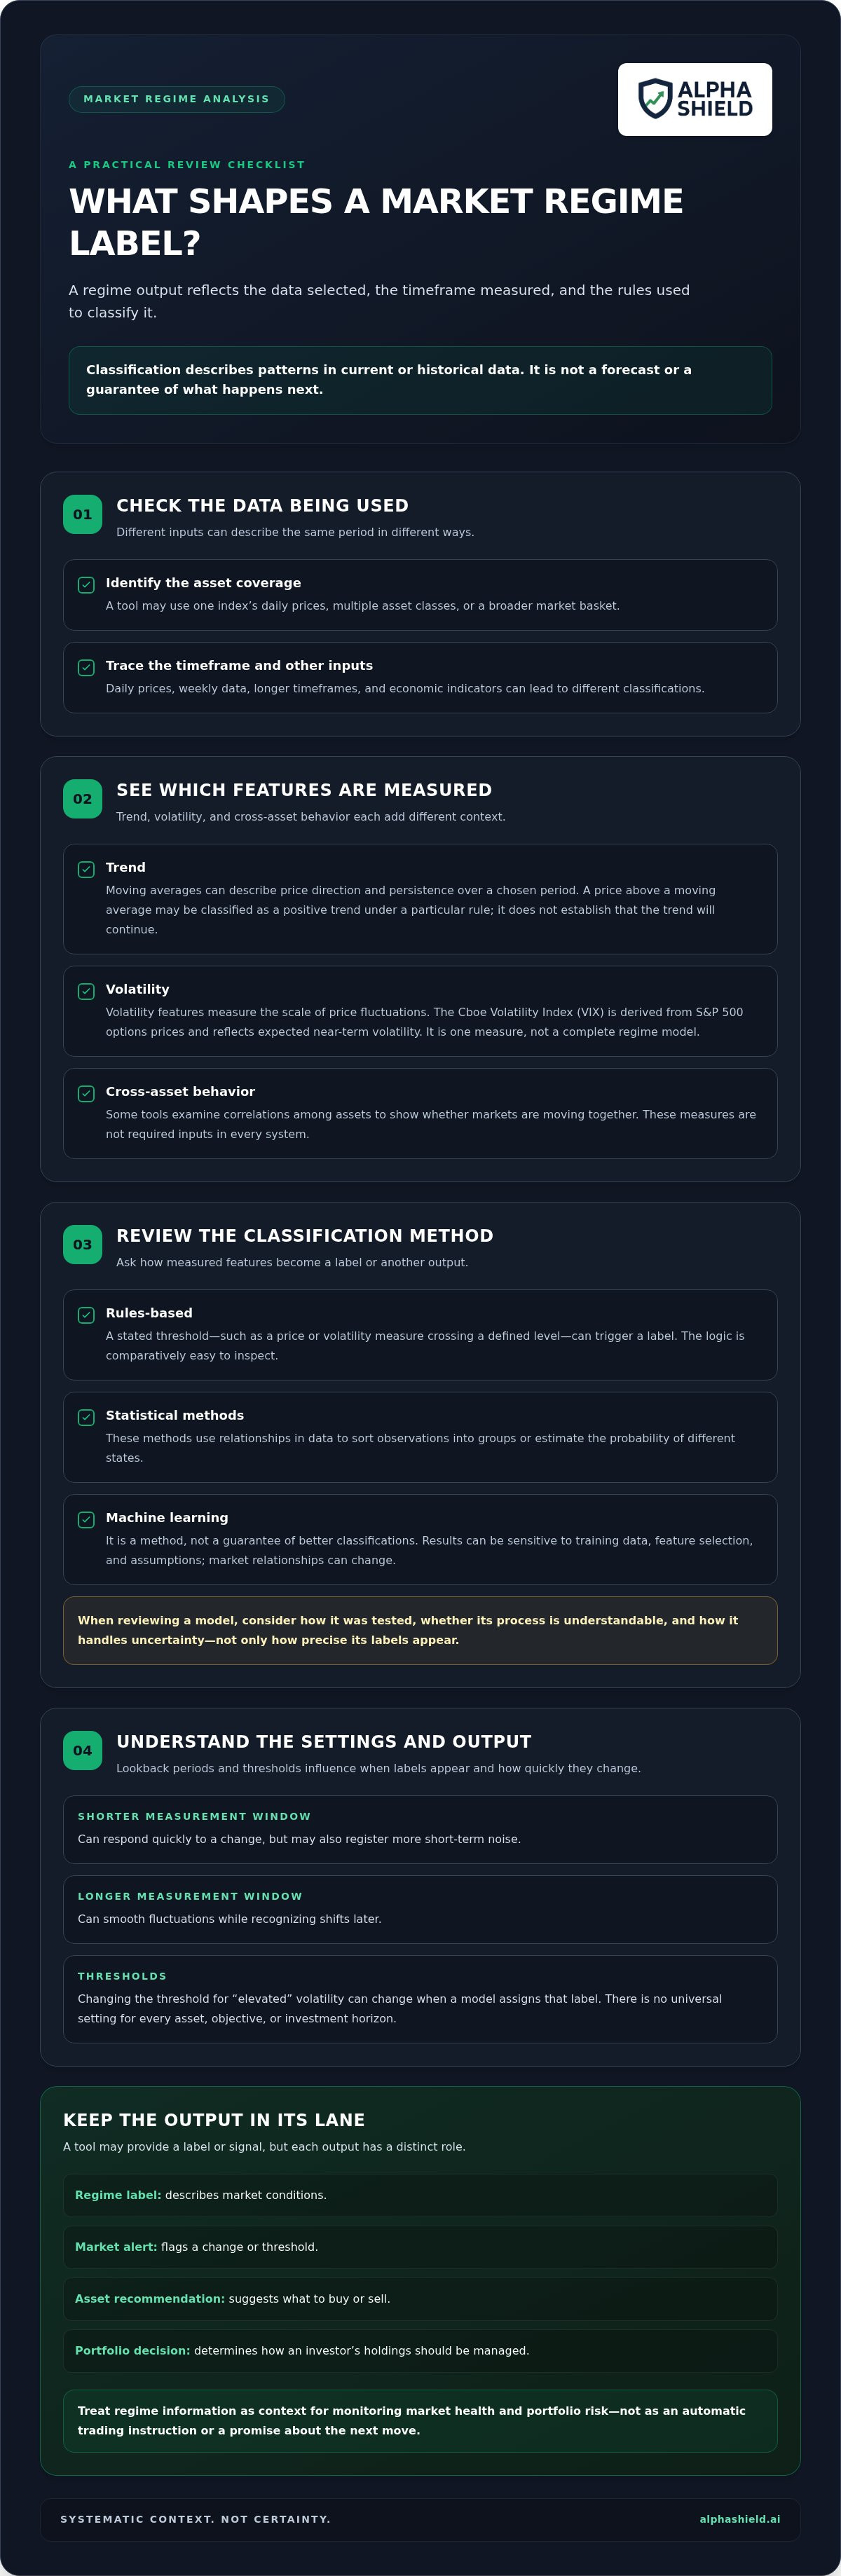
Keep four different outputs distinct. A regime label describes conditions. A market alert flags a change or threshold. An asset recommendation suggests what to buy or sell. A portfolio decision determines how an investor’s holdings should be managed. A tool may provide a label or signal, but that output does not automatically make the other decisions.
What does a market regime label describe?
A label might describe a trending market, a range-bound market, or elevated volatility. These are useful examples, not universal categories with fixed definitions. One model may define a trend as persistent movement over a selected lookback period; another may require different evidence. Volatility thresholds and liquidity measures can also vary.
The label therefore depends on the model, timeframe, asset universe, and data inputs. A tool focused on daily prices may classify conditions differently from one using weekly data or a broader market basket. Two tools can assess the same period and assign different labels without either necessarily being broken. They may measure different features or apply different rules. For background on directional movement, see this overview of market trend.
How regime identification differs from a market signal
Classification interprets conditions in the data. A signal is an output that may support monitoring or feed into a defined, rule-based process. It can simplify information, but it is not automatically a trading instruction, an asset recommendation, or a portfolio allocation decision. Those decisions require their own rules and must account for an investor’s objectives, holdings, and risk tolerance.
In practice, a regime label can help frame a review: Has volatility changed? Is the market’s direction becoming less consistent? Does the current environment affect which risks a portfolio should be monitored for? A label cannot answer these questions with certainty, but it can make the review more systematic. For a broader process, see this guide to systematic risk mitigation.
How Market Regime Identification Tools Analyze Data
Most market regime identification tools follow a sequence: select data, calculate measurable features, apply classification rules, then display a label or another output. Each step affects the result. A tool built from one index’s daily prices may tell a different story from one that combines multiple asset classes, longer timeframes, or economic indicators.
A regime output reflects the data selected, the timeframe measured, and the rules used to classify it.
Lookback periods and thresholds matter. A short measurement window can respond quickly to a change, but may also register more short-term noise. A longer window can smooth fluctuations while recognizing shifts later. Changing the threshold for “elevated” volatility can also change when the model assigns that label. There is no universal setting for every asset, objective, or investment horizon.
Common inputs: trend, volatility, and cross-asset behavior
Trend features, such as moving averages, describe the direction and persistence of prices over a chosen period. A particular rule might classify a price above a moving average as a positive trend. That reading does not establish that the trend will continue.
Volatility features measure the scale of price fluctuations. The Cboe Volatility Index, or VIX, is derived from S&P 500 options prices and reflects expected near-term volatility. It can provide useful volatility context, but it is one measure, not a complete regime model. Some tools also examine correlations among assets or other cross-asset behavior. These measures can show whether markets are moving together, but they are not required inputs in every system.
Rules-based, statistical, and machine-learning approaches
A transparent rules-based model might assign a label when a price or volatility measure crosses a stated threshold. Its logic is comparatively easy to inspect. Statistical methods instead use relationships in the data to sort observations into groups or estimate the probability of different states. State Street's analysis of market regimes offers an example of applying machine learning to identify distinct regimes.
Machine learning is a method, not a guarantee of better classifications. Models can be sensitive to their training data, feature selection, and assumptions. Market relationships can also change, so a model that describes past data well may behave differently in new conditions. When evaluating one, consider how it was tested, whether its process is understandable, and how it handles uncertainty. Do not judge it only by how precise its labels appear.
For investors seeking a systematic reference for monitoring market health and portfolio risk, the Alpha Shield Market Signal provides a signal-based approach. Its purpose is to provide risk context, not certainty about the next market move.
How to Compare Market Regime Identification Tools
Compare tools by what they measure and what they are designed to produce, not by how confident or simple their labels look. A charting platform may display raw indicators for you to interpret. A classification tool groups observed conditions. A systematic signal may turn analysis into a consistent monitoring output. These functions can complement each other, but they are not interchangeable.
| Comparison factor | What to examine |
|---|---|
| Inputs | Which assets, price measures, volatility data, correlations, or other inputs are included? |
| Timeframe | What observation window and update frequency shape the reading? |
| Methodology transparency | Are the classification rules, model approach, or label definitions explained? |
| Output | Does the tool show raw data, classify conditions, or provide a systematic signal? |
| Intended user | Is it designed for self-directed analysis, portfolio monitoring, or another workflow? |
This comparison clarifies a tool’s fit and scope. A raw-data display can support independent analysis without assigning a regime. A classifier interprets data using its own definitions. A signal may provide a concise monitoring output, but it still does not make a portfolio decision for you. Avoid ranking tools unless you have comparable evidence and know they serve the same purpose.
What data and timeframe does the tool use?
Look for a clear description of asset coverage, input data, and observation window. A short lookback may respond more quickly to recent movement, while a longer one may produce a smoother reading. The same market can therefore receive different classifications across tools. If methodology details are limited, treat that as a transparency consideration. It is not, by itself, proof that the tool is ineffective.
Does the output clarify uncertainty and limitations?
Useful explanations define each label in plain language and describe what could trigger a change. Check how often outputs update and whether the tool discusses false signals or situations where its classification may be less informative. A warning or signal is a prompt for attention, not certainty about what comes next. For a related explanation, see market volatility warning systems.
Backtests show how a method would have behaved against historical data under particular assumptions. They do not establish future performance. For disciplined long-term monitoring, prioritize understandable inputs, a defined purpose, and clear limits over claims of precise market timing. The most useful tool is one whose output you can interpret in context, not one that appears certain. You can also explore Alpha Shield’s market signal and dashboard as a systematic option for monitoring market health and portfolio risk.
How Long-Term Investors Can Use Regime Information Carefully
A regime reading is most useful when it answers a defined monitoring question. Without that purpose, a changing label can become another reason to react to headlines or short-term market noise.
Regime information provides context for risk decisions, but it cannot remove investment uncertainty.
Use a consistent review process:
- Define the monitoring goal. Start with your time horizon and the risk question you want to examine, such as whether market conditions appear more volatile than before. A tool designed for short-term observations may not answer a long-term portfolio question.
- Understand the label. Check what each category means according to the tool. Terms such as “high risk” or “defensive” can have different definitions across systems, so do not infer more than the methodology supports.
- Review the basis. Look at the indicators or data behind the reading. If a label changes, identify what changed in the inputs and whether the shift fits the tool’s stated rules.
- Assess it in portfolio context. Consider the reading alongside your holdings, diversification, liquidity needs, objectives, and capacity for risk. A regime label alone cannot account for every portfolio constraint.
A measured process for interpreting a regime change
Classifications can lag because they rely on observed data and defined measurement windows. They can also switch frequently when conditions sit near a threshold. A false positive is another possibility: the tool flags a shift that does not develop into a lasting change. These are limitations to account for, not reasons to assume every reading is either decisive or useless.
Record readings at a consistent cadence and note the underlying indicators. This creates a reference for reviewing changes over time. It also reduces the risk of treating one alert, headline, or brief market move as a complete change in the investment environment.
Keep the tool within a broader risk framework
Market regime identification tools can support a structured review, but they do not replace portfolio-level judgment. Diversification, near-term cash requirements, investment horizon, and individual objectives remain relevant regardless of the label. The same market condition can have different implications for investors with different needs. A regime reading should inform questions and monitoring, not serve as an automatic instruction to buy, sell, or change allocation.
For additional context on managing portfolio risk, explore these defensive investing strategies.
Alpha Shield’s market signal and dashboard provide a systematic reference for monitoring market health and portfolio risk. Explore the Alpha Shield Market Signal to see how it can fit into a measured risk-monitoring process.
Where Alpha Shield Fits Among Market Regime Identification Tools
The comparison criteria matter more than a tool’s label or presentation. First understand what a tool is meant to support, what its output represents, and how it fits your monitoring process. For long-term investors focused on market health and portfolio risk, Alpha Shield offers a systematic market signal and a dedicated dashboard for risk monitoring.
A systematic signal for long-term risk monitoring
Alpha Shield Market Signal and the Alpha Shield Dashboard bring structure to market-risk monitoring. A systematic signal can provide a consistent reference point, while the dashboard offers a dedicated place to monitor market health and portfolio risk. Together, they support a disciplined assessment instead of leaving interpretation entirely to the latest headline or market reaction.
This approach is intended for investors seeking risk context and long-term capital preservation. It is not a day-trading tool, a shorting strategy, or a source of individual stock picks. A signal should not be treated as proof that a market turn has been identified. Market conditions can change, and no signal can guarantee that losses or drawdowns will be avoided.
That distinction is central when assessing market regime identification tools: a systematic output can help organize information, but it does not replace your portfolio context or decision process. Its value depends on whether it supports a clear monitoring objective without being mistaken for certainty.
Decide whether this approach matches your objective
Alpha Shield may suit investors whose goal is to monitor broad market health and portfolio risk through a systematic process. It is not designed for someone seeking a specific stock recommendation or an instruction tailored to personal circumstances. The signal and dashboard provide risk context; they are not a substitute for personal financial advice or an automatic directive to buy, sell, or change allocation.
A practical fit test is straightforward: identify the risk question you want to monitor, understand the role of the signal, and consider its output alongside your time horizon, objectives, and portfolio needs. If that matches your approach to long-term risk management, learn more about the market signal and its intended role.
Turn Regime Context Into a More Disciplined Process
Market regime identification tools classify patterns in observed data; they do not tell you with certainty what comes next. Their value depends on understanding the inputs, timeframe, method, and limits behind each reading. For long-term investors, a regime label is best treated as context for reviewing risk, not an automatic instruction to change a portfolio.
Alpha Shield’s systematic market signal and dashboard are designed to support monitoring of market health and portfolio risk, with a focus on long-term capital preservation. System development began in 2017, and Alpha Shield launched in 2019. The company was founded by former investment bankers and global markets professionals with over 50 years of combined experience.
Keep your process measured, informed, and aligned with your long-term objectives. To explore a systematic tool for monitoring market health and portfolio risk, visit Alpha Shield.
Frequently Asked Questions
What are market regime identification tools?
Market regime identification tools classify broad market conditions using patterns in data, such as price direction, volatility, or relationships between assets. A tool might label conditions as trending, range-bound, or unusually volatile according to its own definitions. These labels describe observations over a selected period. They do not, by themselves, forecast the next move, recommend an asset, or determine how a particular investor should manage a portfolio.
How do market regime identification tools work?
Market regime identification tools typically select data, calculate features, apply classification rules, and present an output. For example, a model could measure price movement and volatility over a chosen observation window, then use thresholds or statistical methods to assign a category. Inputs, lookback periods, and update frequency vary by tool. A label is an interpretation produced by that process, so understanding the method helps clarify what the result can and cannot tell you.
Which indicators are used to identify market regimes?
Common inputs include moving averages or other trend measures, realized volatility, correlations between assets, and, in some models, macroeconomic data. The Cboe Volatility Index (VIX), derived from S&P 500 options prices, can provide volatility context, but it is not a complete regime model on its own. Tools differ in which indicators they use, how they combine them, and what thresholds or timeframes they apply.
Can market regime identification tools predict a market crash?
No tool can reliably establish that a crash will happen at a particular time. Some systems identify conditions associated with elevated risk or issue a signal to support closer monitoring. That can help investors consider risk in a more structured way, but it does not guarantee that losses will be avoided or that every downturn will be flagged in advance. Treat any output as context, not certainty or an automatic instruction to trade.
Are market regime tools and volatility indicators the same thing?
No. A volatility indicator measures or estimates a feature of market conditions, such as the scale of price fluctuations or options-implied expectations. A regime tool may use volatility alongside trend, correlations, or other inputs to classify a broader environment. A volatility reading can contribute to a regime assessment without defining it. One metric is not necessarily a complete interpretation of market conditions.
How should long-term investors use market regime information?
Start with a monitoring goal that fits your time horizon. Check what the regime label means, review the data or indicators behind it, and consider the reading alongside portfolio needs such as diversification, liquidity, and investment objectives. Record changes consistently instead of reacting to an isolated headline or alert. A regime reading can inform a risk review, but it should not dictate an allocation change or replace individual financial advice.
Why do different tools identify different market regimes?
Tools can differ because they use different asset coverage, inputs, observation windows, thresholds, and classification methods. One may rely on daily price trends, while another includes volatility or cross-asset relationships over a longer period. Their regime labels may also use different definitions. As a result, two tools can classify the same period differently without necessarily contradicting each other. Compare their stated scope and methods before interpreting the outputs.


