
What if a volatility warning is not a forecast of a crash, but a prompt to review risk? A market volatility warning system can flag rising stress in market data, but it cannot tell you exactly what will happen next or when. That distinction matters when headlines sound urgent and indicators do not all move in sync.
It is reasonable to look for a clear answer when markets become unsettled. Yet measures such as the VIX reflect expectations of volatility, not a guaranteed direction for prices. Other indicators may track different markets or types of risk, so conflicting readings do not necessarily mean one is wrong.
This guide explains what volatility indicators measure, how warning systems translate them into signals, and where their limits lie. You will learn to distinguish a risk-state warning from a crash prediction or an automatic instruction to trade. We also outline practical criteria for assessing a system, including transparent rules, consistent monitoring, and clearly stated limitations. Alpha Shield Market Signal and the Alpha Shield Dashboard provide structured tools for reviewing market risk without treating any signal as certainty.
Key Takeaways
- A market volatility warning system helps interpret changing risk conditions. It does not forecast market direction or guarantee a crash is coming.
- Data, predefined rules, and a clear signal status can make complex market conditions easier to monitor systematically.
- Warnings can arrive late or prove to be false alarms. Quiet volatility does not mean every form of risk has disappeared.
- Assess a system’s methodology, signal meaning, consistency, and stated limitations before relying on its output.
- Alpha Shield Market Signal and the Alpha Shield Dashboard provide structured tools for monitoring market health and portfolio risk.
What a Market Volatility Warning System Measures
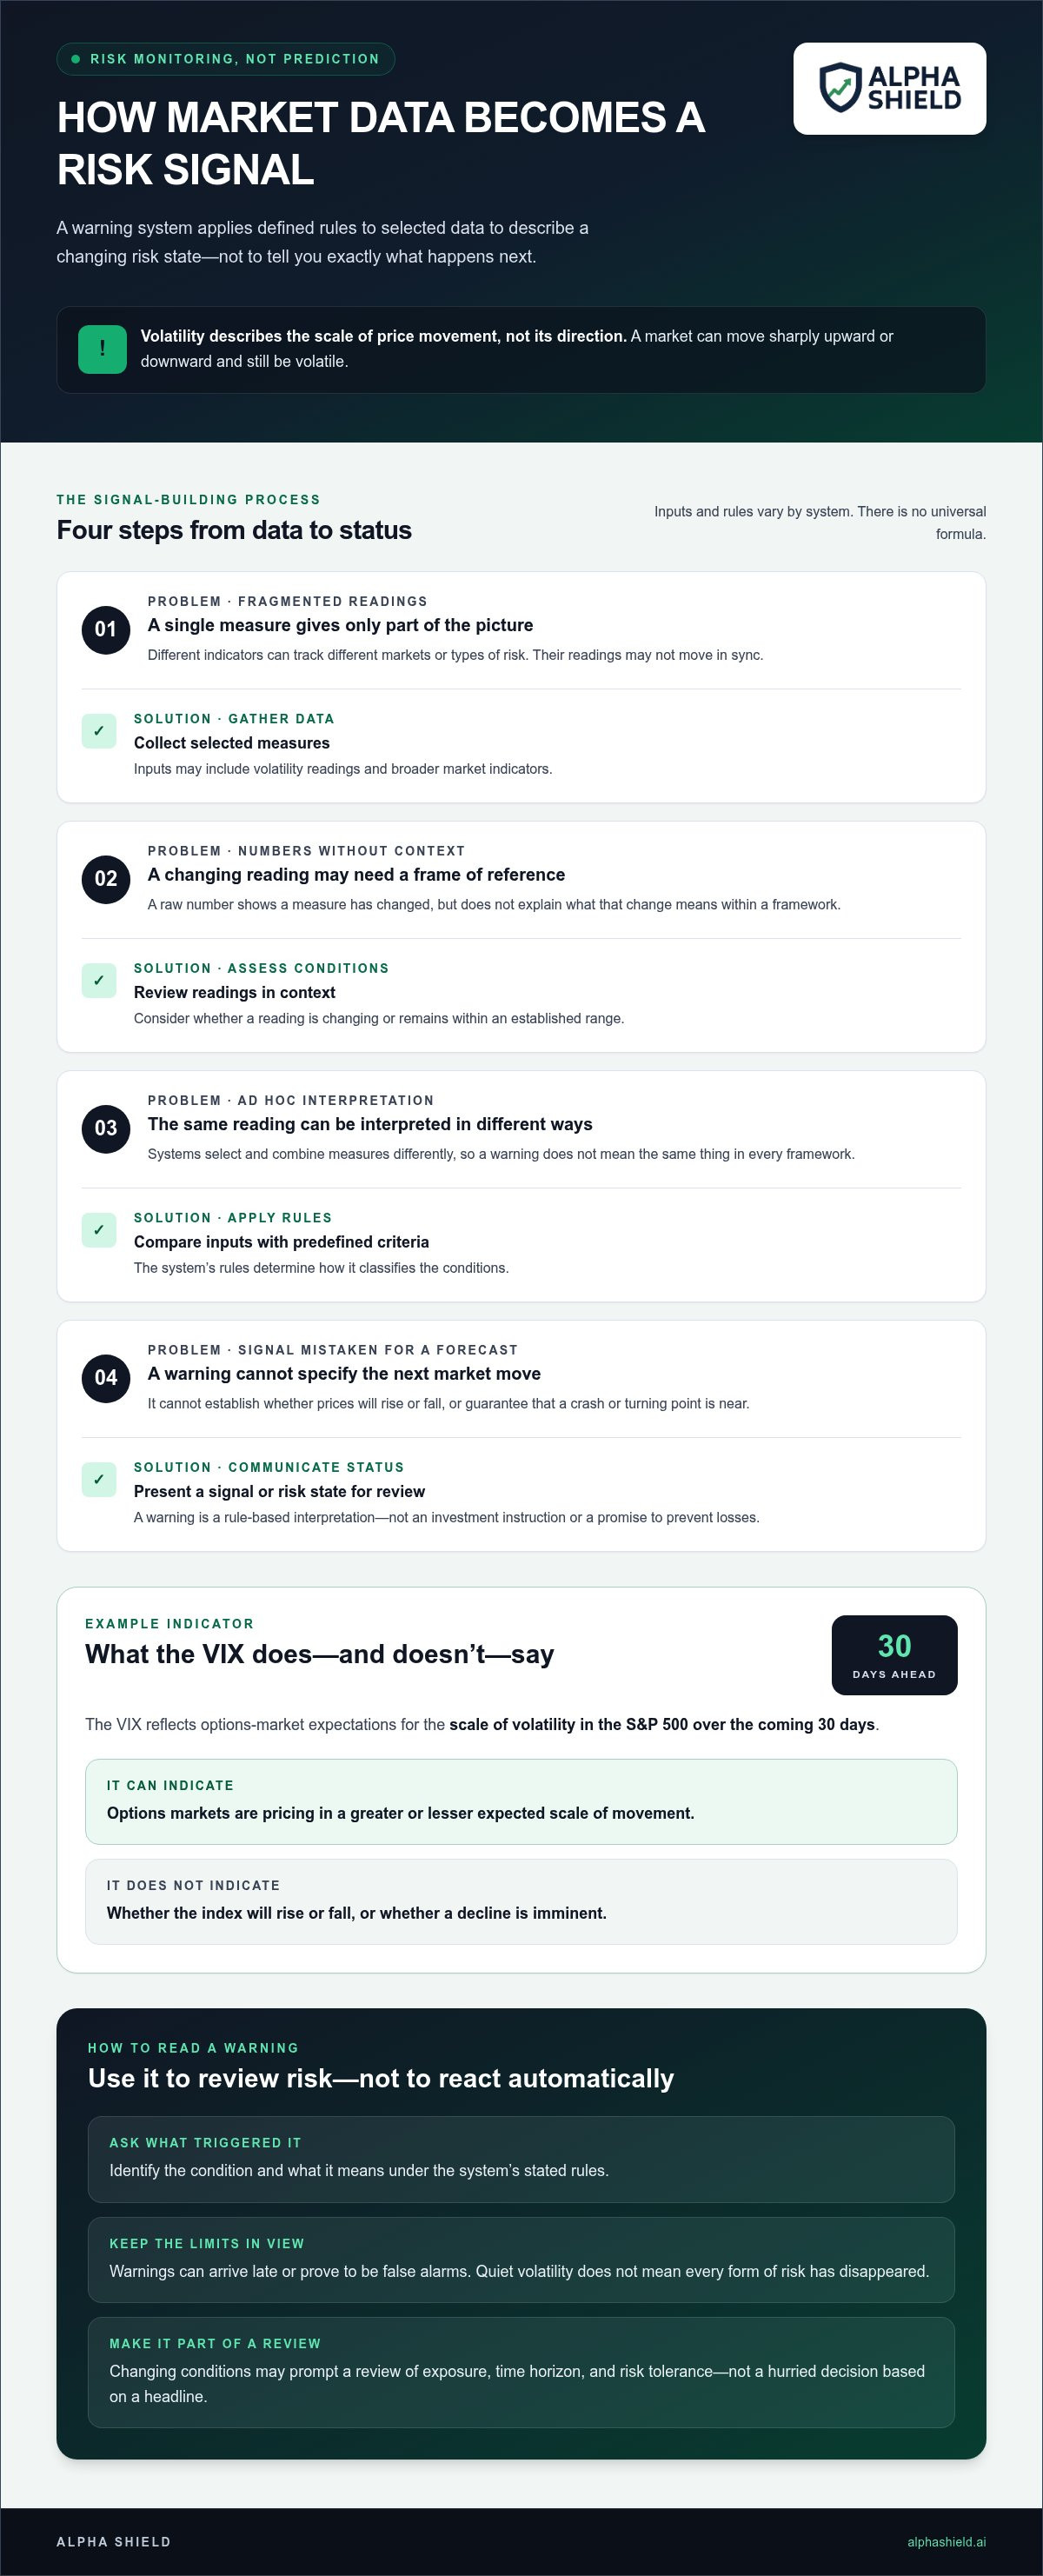
A market volatility warning system interprets changes in selected market data and applies defined rules to identify a changing risk state. It can help investors notice when conditions are becoming less stable. On its own, it cannot establish whether prices will rise or fall, or guarantee that a crash or turning point is near.
Start with what volatility means. Volatility describes the scale of price movement over a period, not its direction. A market moving sharply upward can be volatile, just as a market falling quickly can be. Volatility is one dimension of risk, not a complete account of every threat to a portfolio.
Volatility, market risk, and a warning signal
Realized volatility describes how much prices have varied over a past period. Implied volatility is derived from options prices and reflects the market’s expectation of future movement over a specified period. For example, the CBOE Volatility Index (VIX) reflects options-market expectations for volatility in the S&P 500 over the coming 30 days. It indicates expected magnitude, not whether the index will rise or fall.
A warning signal is a rule-based interpretation of selected data. When an indicator, or a combination of indicators, meets defined conditions, the system may label the environment as higher risk. That status is not an investment instruction. It does not tell every investor to sell, and acting on it cannot promise to prevent losses. To interpret a warning, identify what condition triggered it and what that condition means under the system’s rules.
Why investors monitor volatility conditions
When volatility rises, portfolio values may fluctuate more sharply and near-term price movements may be less predictable. Monitoring these conditions can prompt investors to review exposure, time horizon, and risk tolerance. It does not mean reacting to every market move. A long-term investor might use a warning to revisit an existing plan rather than make a hurried decision based on a headline.
That is the practical role of monitoring: adding structure to a risk review, not urgency. A consistent process can help distinguish changing conditions from short-term noise. For a broader approach, see this systematic risk mitigation framework.
How a Market Volatility Warning System Turns Data into a Signal
A market volatility warning system does more than display an indicator. It processes selected data using a defined method, then communicates what that combination suggests about current risk. Inputs and rules vary by system, so do not assume that every tool uses the same formula or means the same thing by a warning.
The process can be understood in four steps:
- Gather data: Collect relevant measures, which may include volatility readings and broader market indicators.
- Assess conditions: Review the data in context, such as whether a reading is changing or remains within an established range.
- Apply rules: Compare the inputs with predefined criteria. The rules determine how the system classifies conditions.
- Communicate status: Present the result as a signal or risk state that can be reviewed consistently.
An indicator is an input; a signal is the system’s interpretation of that input under defined rules. A raw reading can show that a measure has changed. By itself, it does not explain what that change means within a particular framework.
What volatility measures can and cannot show
The Cboe Volatility Index (VIX) is derived from S&P 500 options prices and represents options-market expectations of volatility over the coming 30 days. It helps describe the expected scale of price movement, not the direction of the next move. A rising VIX may signal that options markets are pricing in greater expected movement, but it does not identify a specific event or establish that a decline is imminent.
Volatility readings are context for risk assessment, not reliable forecasts of a particular market outcome. Even a meaningful change in one measure needs to be interpreted according to the system’s timeframe, other inputs, and rules.
Why context and predefined rules matter
Rules create a repeatable way to interpret data. When a reading changes, a framework can assess it against stated criteria rather than relying on headlines or an immediate reaction. Broader indicators may add context, but systems select and combine measures differently. There is no universal formula.
For example, the U.S. Treasury’s Office of Financial Research publishes a Bank Systemic Risk Monitor focused on risks in the banking sector. It illustrates how a monitoring tool can organize data around a defined risk domain, though it is not a universal market signal or an instruction to trade. For more examples of indicators and their context, see this macro market risk indicators guide.
Investors comparing rule-based approaches can review Alpha Shield’s systematic market signal as one structured input for market-risk monitoring.
Warning Signals, False Alarms, and the Limits of Volatility Data
No market volatility warning system can identify every crash in advance. A warning can indicate rising stress, but it cannot specify exactly when markets will move, how far prices may fall, or whether a decline will occur at all. Treating a signal as certainty confuses risk assessment with prediction.
Signals can still be useful without dictating an all-or-nothing response. A change in risk status may prompt a review of portfolio exposure, time horizon, liquidity needs, and the investor’s established risk process. Whether that review leads to an adjustment depends on the investor’s objectives and plan, not the warning alone.
Can a volatility warning predict a market crash?
No. Volatility data can reflect expectations of larger price movements or changing market stress, but it cannot reliably identify a specific future event or its timing. A warning is not a guarantee of loss, and following one cannot ensure losses will be avoided. It is one input to consider alongside an investor’s goals, portfolio structure, and risk-management rules.
This distinction matters in both directions. If volatility rises and a sharp decline does not follow, the signal may still have identified a change in conditions. If markets remain calm before a sudden shock, a volatility-based system may not provide advance notice. Volatility is only one lens on risk.
How false signals affect interpretation
A false positive is a warning that is not followed by the feared decline within the framework’s chosen evaluation period. The label depends on how the system defines a warning, what outcome counts as a decline, and how long it waits for that outcome. Different thresholds and time windows can classify the same market episode differently.
Signals can also arrive after stress is already visible because rules respond to data that has changed. A quiet volatility reading does not rule out other risks, such as concentrated exposure, liquidity constraints, or deterioration in a specific market segment. No single measure captures every source of portfolio risk.
Historical testing can show how rules behaved against past data under specified assumptions. It cannot prove that the same rules will perform reliably in future conditions. Results may depend on the period, inputs, thresholds, and evaluation method. Claims about accuracy or protection require clearly stated evidence, not a favorable example or a backtest presented as a promise.
Use warnings as prompts for disciplined review, not automatic exit instructions. A broader market crash defense strategies guide can help place signals within a wider capital-preservation process.
How to Evaluate a Market Volatility Warning System
A market volatility warning system is most useful when its method and signal meaning are clear. Evaluate the process, not just the label or the confidence of its presentation. Use this checklist to distinguish a structured risk-monitoring tool from an opaque indicator or a claim of certainty.
- Methodology: Does the system explain what data it uses and how it assesses changing conditions?
- Signal meaning: Are each status and its implications defined in plain language?
- Consistency: Are rules applied systematically, with changes in status communicated clearly?
- Limitations: Does the explanation acknowledge uncertainty and avoid promises of perfect timing or protection?
- Evidence: Are historical tests and results described with their assumptions, without treating past behavior as proof of future outcomes?
Questions that reveal whether a signal is systematic
Look for clear definitions of signal states and the rules that change them. When a status shifts, you should be able to understand what changed in the system’s assessment, even if the market outcome remains uncertain. Check that the tool’s purpose is explicit, too: market-risk monitoring is different from selecting individual stocks or directing short-term trades. Transparent limits are a strength, not a flaw.
A dashboard should make information easier to review consistently. It can present current status and relevant risk indicators in an accessible format, but a general signal is not personalized advice. Clear presentation helps investors understand what the system reports; it does not determine what action suits their circumstances.
Fit the tool to an investor’s decision process
Consider your investment horizon, the purpose of your portfolio, and whether you can review risk conditions consistently. A tool that updates a risk assessment may be useful as part of a planned review. It may be less useful if you treat every status change as a command to make an immediate trade.
Risk monitoring should complement, not replace, your financial plan. Diversification and asset allocation address how a portfolio is structured. A warning system can provide another input for reviewing market conditions, but it does not make those decisions for you or remove the need for judgment.
Keep system design separate from assumptions about investment results. A clear process explains how a signal is generated. Evidence about past behavior describes how it performed under specific historical conditions. Neither establishes what will happen next. Assess the rules, the evidence, and the limits as separate questions.
How Alpha Shield Fits into Systematic Market Risk Monitoring
Once you understand what volatility measures and where warning signals fall short, the next step is deciding how to include them in a broader risk process. Alpha Shield Market Signal is a systematic input for monitoring market health and managing portfolio risk. It is designed around long-term capital preservation, not day trading, shorting, or individual-stock recommendations.
What a market signal dashboard helps investors monitor
Alpha Shield Market Signal uses analysis of the VIX futures curve to provide a daily status: “IN” (Risk ON) or “OUT” (Risk OFF). The Alpha Shield Dashboard presents market-risk indicators in a dedicated place, making it easier for investors to review signal status and related information consistently.
A dashboard supports a process by making status easier to revisit, rather than requiring investors to interpret each headline or market move from scratch. The signal is decision support for risk monitoring. It does not predict a crash with certainty, dictate a personalized portfolio decision, or guarantee protection from losses. Investors still need to consider their own objectives, time horizon, and risk plan.
A disciplined next step after understanding the warning
A measured review follows a clear sequence: understand what a measure reflects, interpret how the system turns inputs into a signal, assess the signal’s limits, then review portfolio risk in light of your own plan. Defining the role of a warning in advance can help keep its meaning clear when volatility rises. It also reduces the chance of treating a changing status as an automatic instruction.
Alpha Shield’s signal and dashboard support systematic monitoring, not replace an investor’s judgment or broader financial plan. Their purpose is to provide a structured reference point for reviewing market conditions. No signal can remove market uncertainty, and no dashboard can determine the right decision for every portfolio.
For a closer look at this approach, explore the Alpha Shield Market Signal.
Make Volatility Signals Part of a Clear Risk Process
A market volatility warning system interprets changes in risk conditions. It does not predict every crash or provide a guaranteed exit signal. Its value depends on how clearly it defines its inputs, rules, signal status, and limitations. Use a warning as a reason to review portfolio risk within your broader plan, not as a substitute for judgment.
Alpha Shield’s approach is built around systematic market-risk monitoring, not stock picks or shorting. Founded by former investment bankers and global markets professionals with over 50 years of combined experience, the company began developing its system in 2017 and launched in 2019. Its Market Signal and Dashboard give investors tools to monitor market health and review risk conditions in a structured way.
Understanding the measure, interpreting the signal, and accounting for uncertainty can help you respond with more discipline when markets become unsettled. A defined process is a steadier foundation than reacting to every headline.
Use Alpha Shield’s signal and dashboard as structured tools for monitoring market risk and reviewing market conditions.
Frequently Asked Questions
What is a market volatility warning system?
A market volatility warning system interprets changes in selected market data to assess current risk conditions. It may use volatility measures, broader indicators, or a combination, then apply defined rules to communicate a status. Volatility describes the scale of price movement, not its direction. A warning can prompt a closer review of risk, but it does not establish that a crash is coming or tell every investor what action to take.
How does a market volatility warning system work?
A market volatility warning system gathers relevant data, assesses current conditions, applies predefined rules, and reports a signal or risk status. For example, a framework might compare an indicator with a stated threshold or evaluate several inputs together. The exact data and rules vary by system. The indicator is the measurement; the signal is the framework’s interpretation. Understanding the rules helps clarify what a status change does and does not mean.
Can volatility indicators predict a stock market crash?
No. Volatility indicators can reflect changing expectations or market stress, but they cannot reliably specify whether a crash will occur, when it might happen, or how severe it could be. A warning may support a review of portfolio risk, but it is not a precise forecast or a guaranteed exit instruction. Interpret it alongside your objectives, time horizon, and established decision process rather than treating it as certainty.
Is the VIX a reliable market warning signal?
The VIX is a useful measure of options-market expectations for S&P 500 volatility over the coming 30 days, but it is not a standalone crash predictor. It indicates the expected magnitude of movement, not whether prices will rise or fall. Its meaning depends on context, timeframe, and how a broader framework interprets it. Investors can use it as one input for assessing risk while recognizing that it cannot capture every market or portfolio risk.
What happens if a volatility warning is a false alarm?
A false alarm, or false positive, occurs when a warning is not followed by the decline the system was designed to flag within its chosen evaluation period. Classification depends on the warning threshold, the definition of the feared outcome, and the timeframe being assessed. A warning can still indicate a change in conditions even if a decline does not follow. Review what triggered it and how it fits your risk plan before deciding whether to adjust your portfolio.
How should long-term investors use a market warning signal?
Long-term investors can use a warning as a prompt to review portfolio exposure, time horizon, liquidity needs, and their existing plan. It does not require an automatic trade or a sudden shift in strategy. Decide in advance how market-risk information fits into your review process, then apply that process consistently. A signal can add context to decisions about diversification and allocation, but it does not replace those decisions or the investor’s judgment.
Does a market volatility warning system guarantee portfolio protection?
No. A market volatility warning system cannot guarantee that losses will be avoided, identify every source of risk, or predict every market decline. Its signal reflects the data and rules it uses, which have limits and may respond late or produce false positives. Treat it as one structured input to risk monitoring. Portfolio outcomes still depend on market conditions, portfolio choices, and how an investor applies their broader plan.


