

Economic headlines don't protect capital; they merely document the damage after it happens. If conflicting financial commentary leaves you frozen in analysis paralysis, you aren't alone. Daily news cycles generate endless noise, making it exceptionally difficult to separate standard market fluctuations from the systemic structural risks that can erase years of retirement wealth. Reacting to media sentiment leads to costly mistakes. Real capital preservation requires measuring market plumbing rather than lagging opinions. By tracking quantitative macro market risk indicators, you replace subjective forecasting with objective, data-driven clarity.
In this guide, you'll discover how institutional macro market risk indicators identify systemic vulnerabilities before catastrophic portfolio drawdowns occur. We examine the essential metrics tracking credit stress, yield curve behavior, and monetary liquidity, establishing a non-discretionary framework designed to defend your capital systematically. You'll gain the exact tools needed to eliminate emotional bias, see past late-cycle euphoria, and navigate sudden market contractions with disciplined precision.
Key Takeaways
- Learn how quantitative macro market risk indicators track real-time liquidity, credit stress, and volatility to detect systemic vulnerabilities before severe drawdowns occur.
- Discover the four essential capital transmission channels institutional risk managers monitor to evaluate the true structural stability of financial markets.
- Understand why backward-looking government data releases fail to protect capital, and how leading market pricing provides advance warning long before economic revisions appear.
- Build a non-discretionary risk-monitoring framework that converts complex macro inputs into binary rules, removing emotional bias from critical capital allocation decisions.
- See how systematic capital preservation tools replace subjective market forecasting with disciplined, data-driven protection for long-term wealth.
What Are Macro Market Risk Indicators in Systematic Investing?
Macro market risk indicators quantify cross-asset liquidity, credit stress, and volatility pricing across the global financial architecture. Unlike microeconomic research that isolates corporate earnings or balance sheet health, these metrics track structural conditions governing broad market beta. They evaluate the market's internal plumbing. When underlying transmission channels experience friction, asset prices eventually reflect that strain. Institutional capital doesn't rely on speculative forecasts or televised commentary to manage exposure; it relies on mechanical, quantitative measurements to gauge systemic vulnerability.
The Functional Difference Between Market Sentiment and Objective Risk Signals
Retail sentiment surveys measure what investors say. Objective risk signals measure where capital actually moves. Surveys reflect emotional bias and retail opinion, both of which reverse rapidly during periods of market stress. In contrast, institutional signals track capital commitments across interbank lending, sovereign debt, corporate credit, and derivatives. While public commentary often focuses on subjective interpretations of leading and lagging economic indicators, systematic allocators prioritize cold transactional pricing. Evaluating real-time pricing stress allows disciplined allocators to implement proven market crash defense strategies before systemic deterioration forces broad liquidations.
The Core Objective: Capital Preservation and Drawdown Mitigation
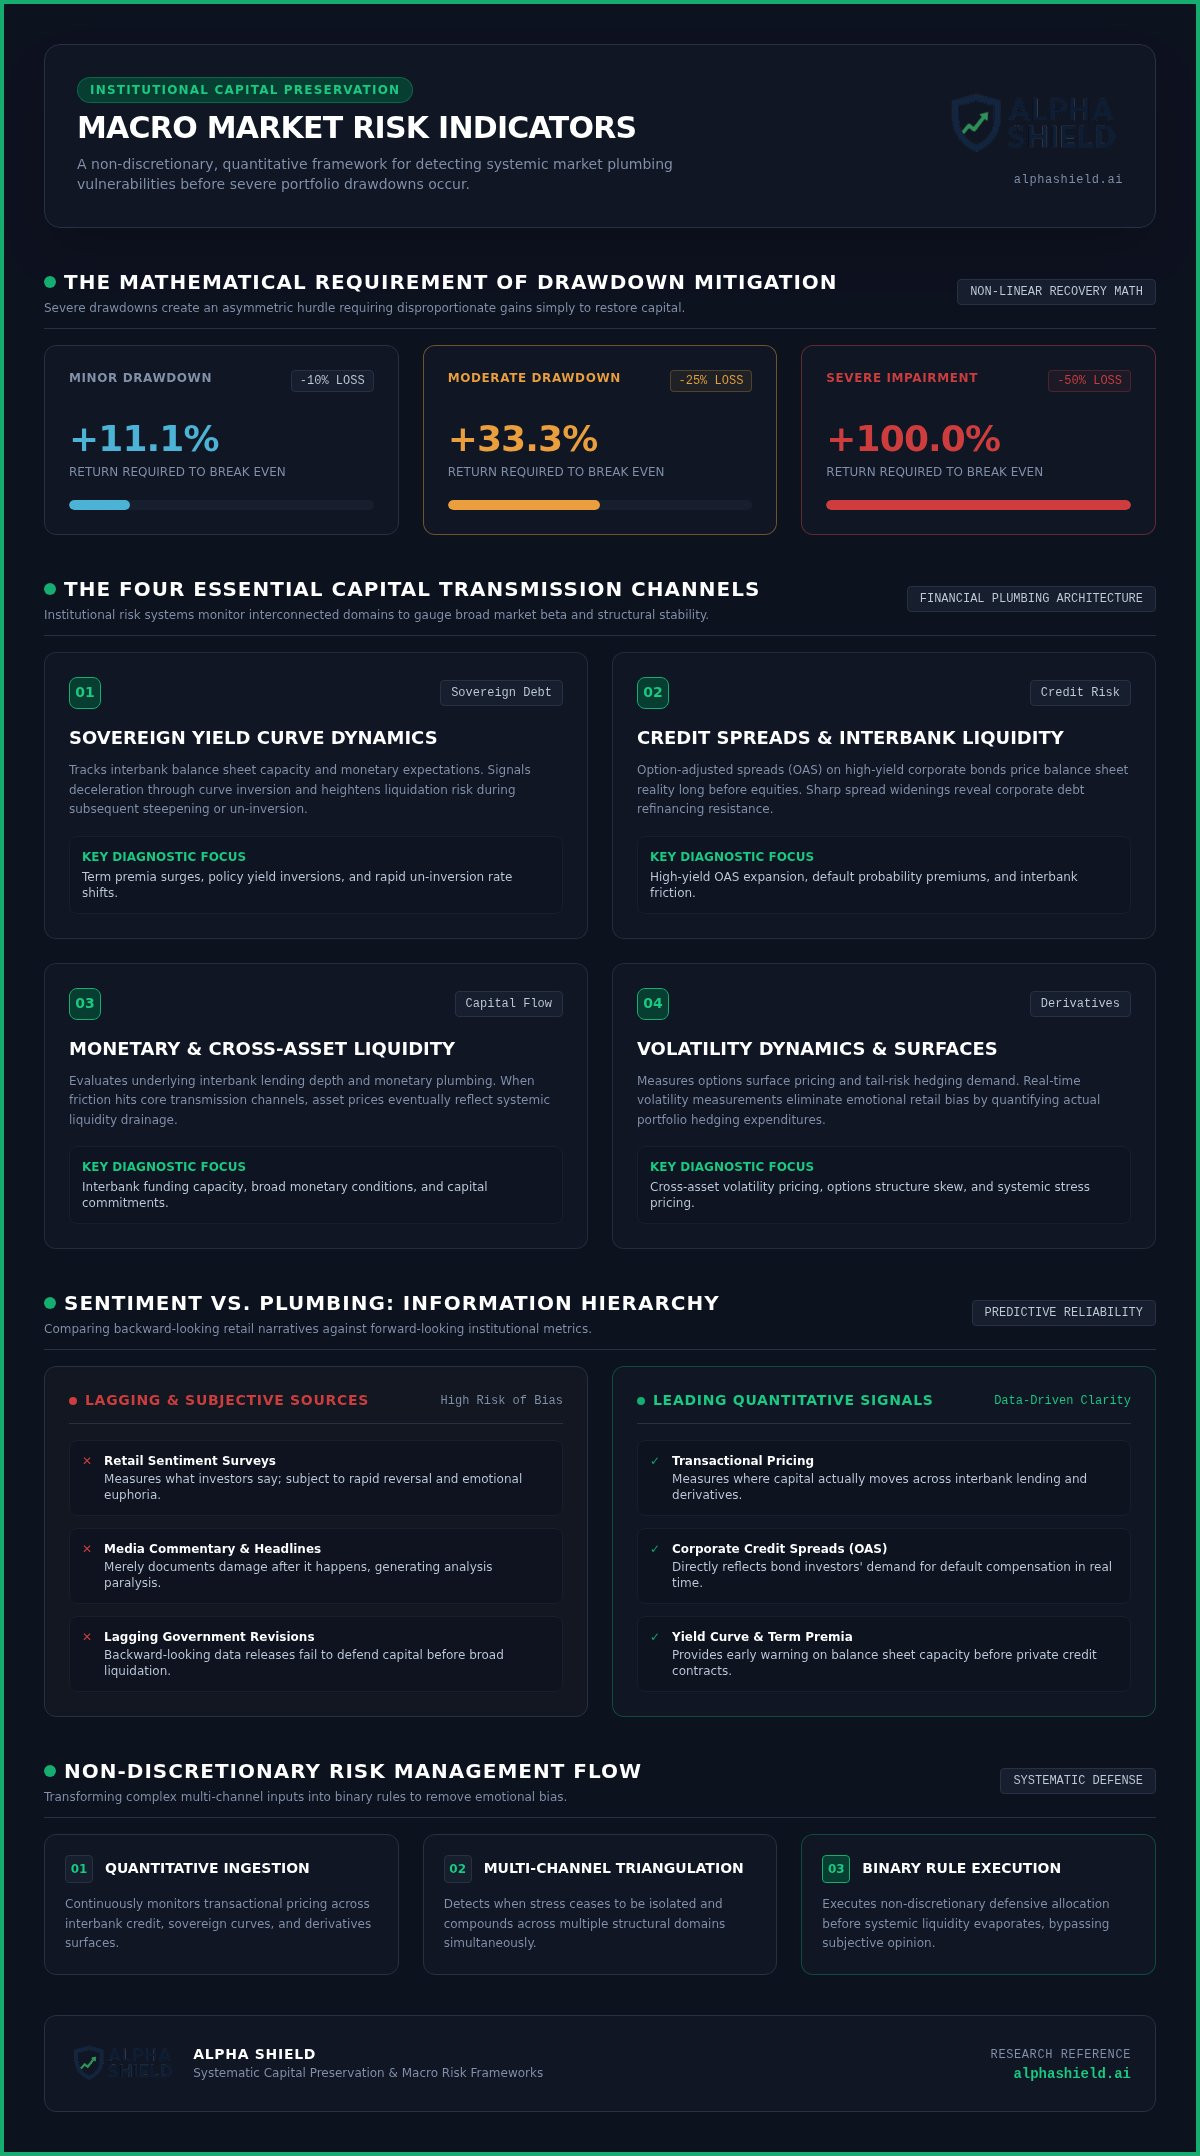
Capital preservation isn't a defensive posture; it's a mathematical requirement for compounding wealth over decades. Severe portfolio drawdowns create an asymmetric hurdle that requires disproportionate gains simply to break even. The portfolio math is absolute:
- A 10 percent drawdown requires an 11.1 percent return to recover.
- A 25 percent drawdown requires a 33.3 percent return to break even.
- A 50 percent loss demands a full 100 percent return just to restore lost capital.
When investors suffer a 50 percent loss, they don't just lose half their assets. They lose the multi-year compounding potential of that capital. Macro market risk indicators establish rule-based boundaries that defend capital systematically before systemic liquidity evaporates, removing emotion from defensive asset allocation.
The Four Essential Categories of Macro Market Risk Indicators
Institutional risk systems do not evaluate market health through a single metric. They track stress across interconnected capital transmission channels. When friction appears in one isolated channel, markets can often absorb the pressure. When systemic stress compounds across several channels simultaneously, broad liquidations follow. A disciplined monitoring model categorizes macro market risk indicators into four structural domains, reflecting the framework detailed in the Federal Reserve Financial Stability Report: sovereign yields, credit conditions, market liquidity, and volatility dynamics.
Sovereign Yield Curve Dynamics and Term Premia
Treasury yield curves illustrate the pricing of interbank balance sheet capacity and long-term monetary expectations. An inversion between short-term policy yields and long-term sovereign rates signals structural deceleration. Yet the inversion itself is rarely the liquidation trigger. The danger intensifies during the subsequent steepening or un-inversion, when short rates fall rapidly or term premia surge to reflect underlying economic strains. Monitoring yield curve shifts provides essential context on funding conditions before private credit contracts.
Credit Spreads and Interbank Liquidity Measures
Credit markets price balance sheet reality long before equities acknowledge distress. Option-adjusted spreads (OAS) on high-yield corporate bonds measure the exact premium investors demand to absorb default probability. Spreads sitting below historical averages reflect loose credit conditions, but sharp spread widenings indicate that interbank lending and corporate debt refinancing face acute resistance. When bond investors refuse to finance lower-tier obligations without massive compensation, equity valuations inevitably recalibrate downward.
Volatility Surface and VIX Futures Term Structure
Headline equity volatility provides a narrow view of aggregate risk pricing. A complete quantitative framework looks deeper into the volatility surface:
- Futures Term Structure: Normal markets trade in contango, where longer-dated volatility contracts price higher than spot values. An inversion into backwardation signals immediate hedging demand and balance sheet distress.
- Volatility Skew: The pricing differential between out-of-the-money puts and calls reveals institutional appetite for deep tail-risk hedges.
- Dispersion Spreads: When single-stock volatility surges while broad index volatility remains suppressed, market internals are fragmenting underneath a calm surface.
Tracking these multi-factor relationships manually requires continuous institutional-grade data ingestion. Implementing an objective monitoring system like the Alpha Shield Dashboard allows allocators to isolate genuine systemic stress from transient market noise.
Leading vs. Lagging Indicators: Evaluating Predictive Reliability
Leading market prices precede backward-looking macroeconomic revisions by months. Financial media consistently focuses on lagging government data releases, drawing attention to figures that describe historical activity rather than emerging systemic vulnerabilities. Relying on rear-view reporting to manage wealth creates severe portfolio drag. Capital preservation requires measuring real-time liquidity and asset-pricing stress. Effective macro market risk indicators monitor active market plumbing rather than trailing surveys or bureaucratic reports, giving allocators the advance warning required to defend their portfolios.
The Inherent Latency of Traditional Economic Releases
Government statistical agencies aggregate data with considerable friction. Headline figures like Gross Domestic Product (GDP) and monthly payroll numbers are heavily revised weeks or months after their initial release. Coincident metrics, such as real-time recession indicators tracking unemployment thresholds, often trigger long after liquidity strains have begun. Waiting for government data to confirm contraction exposes capital to the sharpest phase of market drawdowns. The damage happens during the gap between reality and confirmation.
Market-Based Price Signals as Real-Time Truth Mechanics
Markets represent live execution venues where institutions place real capital at risk. Credit default swaps, currency cross-rates, and repo transactions reprice continuously to reflect evolving systemic threats. By monitoring institutional measures like the OFR Financial Stress Index, allocators capture real-time stress signals across credit, equity, funding, and volatility markets simultaneously. These market-derived metrics act as objective truth mechanics, offering clear advantages over traditional data releases:
- Immediate Data Transmission: Market prices reflect institutional risk reallocation instantly, eliminating reporting lag and subjective estimation.
- Absence of Revisions: Transactional spreads and derivative pricing are final execution prints, never subject to retroactive government revisions.
- Narrative Elimination: Forward-looking price structures strip away corporate earnings optimism and political spin, isolating pure liquidity conditions.
When quantitative macro market risk indicators detect severe stress in funding plumbing, price action provides the earliest warning. Listening to real-time market signals allows systematic allocators to adjust capital exposure long before official recession warnings dominate public headlines.
How to Construct a Systematic Risk-Monitoring Framework
A functional risk monitoring framework translates complex market inputs into binary actions. Tracking macro market risk indicators serves little purpose if the resulting data leads to endless subjective debate. When systemic volatility spikes, human psychology defaults to hesitation, rationalization, and paralysis. Eliminating subjective discretion requires building a mechanical architecture that operates on strict if-then rules. Clarity of process remains the foundational prerequisite for multi-cycle capital preservation.
To convert multi-asset signals into an institutional-grade defense system, allocators follow five sequential steps:
- Channel Selection: Isolate core structural inputs across sovereign yield curves, high-yield credit spreads, funding liquidity, and volatility dynamics.
- Metric Normalization: Convert diverse raw metrics into standardized z-scores or percentile ranks to evaluate relative stress on a unified scale.
- Composite Scoring: Aggregate normalized values into a single structural stress gauge rather than analyzing isolated data points in silos.
- Binary Thresholds: Establish explicit numerical lines where the portfolio shifts from standard allocation to defensive risk-off postures.
- Mechanical Execution: Execute predetermined defensive actions automatically when thresholds breach, eliminating emotional deliberation.
Establishing Mechanical Thresholds and Non-Discretionary Triggers
Ambiguity destroys portfolio performance during market contractions. When credit spreads blow out or term structures invert, investors shouldn't debate whether the market feels dangerous. The rules must be defined before the crisis arrives. Establishing non-discretionary triggers ensures you step aside systematically when systemic risks breach historical boundaries. This disciplined execution model underpins the core philosophy behind alpha shield, ensuring wealth remains protected regardless of prevailing narrative spin.
Filtering Noise to Avoid Data Overfitting and Paralysis
More data rarely produces better decisions. Tracking dozens of noisy, redundant indicators generates analytical friction, leading directly to decision paralysis. Robust frameworks select a minimal set of structurally sound macro market risk indicators that demonstrate explanatory power across decades of market regimes. Synthesizing these critical transmission channels into a single, cohesive signal strips away market hysteria, leaving you with an unambiguous operational directive.
Systematic Capital Preservation: The Alpha Shield Advantage
Emotional conviction remains the single most destructive variable in wealth management. Investors routinely convince themselves that economic cycles can be predicted, corporate balance sheets are immune, or late-stage bull markets will continue indefinitely. Yet market dynamics don't bend to optimism. Capital preservation demands emotional detachment. Founded by veteran investment bankers and global markets trading professionals with over 50 years of institutional markets expertise, Alpha Shield removes human bias entirely. Initiated in 2017 and launched in 2019, the system tracks underlying macro market risk indicators through cold, non-discretionary execution.
The Structural Failure of Emotional, Discretionary Decision-Making
Discretionary decision-making fails predictably across cycle inflection points. When speculative euphoria peaks, greed encourages allocators to ignore deteriorating underlying conditions. Conversely, when broad selling intensifies, fear forces panic liquidations near the bottom, cementing losses after capital has already eroded. Systematic signals protect investors from their own psychology. A mechanical framework doesn't guess or extrapolate narratives; it decodes systemic health to separate standard volatility from catastrophic drawdown regimes.
Actionable Market Intelligence via the Alpha Shield Dashboard
Most retail platforms push speculative day trading, unhedged short positions, or stock-picking gimmicks. Alpha Shield explicitly rejects these approaches. The philosophy focuses on simplicity as a professional discipline, translating deep institutional plumbing into clear execution signals. The engine filters complex multi-asset data, so you never have to interpret raw econometric tables under pressure.
Through institutional-grade risk visualization, the platform provides several clear advantages:
- Systematic Objectivity: Eliminates subjective economic forecasting by tracking empirical cross-asset stress channels.
- Operational Simplicity: Replaces cognitive overload with binary clarity, indicating exactly when market regimes require defense.
- Long-Term Protection: Operates strictly as a capital defense tool, avoiding the turnover and risks of day-trading operations or complex shorting strategies.
Preserving multi-decade wealth requires a rational anchor when market environments become detached from fundamentals. Experience institutional-grade risk monitoring through the Alpha Shield Dashboard to defend your capital systematically across any market environment.
Defending Wealth Through Objective Quantitative Discipline
Surviving severe market cycles requires abandoning reactionary headlines and emotional guesswork. By tracking quantitative macro market risk indicators across sovereign yield curves, credit spreads, and structural liquidity, disciplined allocators replace speculation with measurable clarity. When the underlying market plumbing shows systemic strain, a rules-based process executes protection before capital erodes.
Architected by veteran institutional investment bankers and global markets traders with over five decades of combined capital risk management experience, Alpha Shield delivers an objective framework for long-term security. The platform relies on a purely quantitative signal, eliminating emotional bias, complex shorting, and speculative stock picking. Capital preservation isn't about predicting every daily fluctuation; it's about systematically avoiding catastrophic portfolio drawdowns.
With an institutional, non-discretionary defense system in place, you can step away from financial media noise and navigate any market regime with confidence.
Frequently Asked Questions
What are the most reliable macro market risk indicators for long-term investors?
The most reliable indicators monitor structural plumbing across credit, sovereign debt, and volatility rather than equity valuations alone. High-yield option-adjusted spreads, Treasury yield curve slope dynamics, interbank liquidity gauges, and VIX futures term structures offer the clearest view of systemic health. A quantitative framework tracks these multi-asset signals in unison. Combining them prevents the blind spots caused by relying on any isolated metric.
Can macro market risk indicators accurately predict the timing of a stock market crash?
Quantitative indicators don't predict exact dates; they quantify conditions where market fragility becomes mathematically unsustainable. Macro market risk indicators assess whether financial plumbing is orderly or vulnerable to cascade liquidations. Think of them like structural engineering stress tests. They evaluate when the support beams are cracking so allocators can step aside before an inevitable shock causes broad systemic failure.
How do credit spreads function as an early warning signal for equity market drawdowns?
Credit spreads measure the risk premium institutional lenders demand to absorb corporate default probability. Bond investors conduct deep balance sheet analysis and react to insolvency risks long before public equity markets adjust. When option-adjusted spreads widen, it signals that borrowing costs are rising and corporate liquidity is contracting. Equities eventually reprice lower to reflect these constrained borrowing fundamentals.
What is the practical difference between economic indicators and market risk indicators?
Economic indicators measure past economic performance, while market risk indicators measure real-time financial pricing. Metrics like gross domestic product and unemployment figures are backward-looking surveys subject to major retrospective revisions. In contrast, market indicators evaluate live transactional data from sovereign bonds, credit default swaps, and options contracts. They reflect actual capital commitments without administrative lag or political narrative bias.
How does the VIX futures term structure identify hidden liquidity risks?
The slope of the VIX futures curve reflects institutional demand for immediate versus future tail-risk protection. In balanced markets, the curve remains in contango, meaning spot volatility trades lower than forward contracts. When the curve flips into backwardation, institutions are actively paying a massive premium for immediate portfolio protection. This inversion reveals acute liquidity withdrawal across the institutional options complex.
What happens if macro risk indicators trigger an exit signal during a market rally?
Systematic frameworks execute defense based on structural fragility, even if speculative momentum temporarily continues. Late-stage bull markets frequently experience narrow rallies powered by speculative euphoria while underlying credit and liquidity metrics deteriorate. A rules-based framework prioritizes capital preservation over capturing the final speculative advance. Sacrificing marginal upside is the trade-off that ensures your wealth avoids catastrophic drawdowns.
How does a systematic risk dashboard differ from speculative day-trading tools?
Systematic risk platforms defend long-term wealth, whereas day-trading tools encourage hyperactive turnover. Alpha Shield doesn't offer shorting strategies, leveraged trades, or individual stock recommendations. Instead, the Alpha Shield Dashboard serves as an institutional drawdown prevention tool. It decodes systemic cross-asset stress into clear signals, helping multi-cycle allocators manage portfolio exposure safely without speculative noise.


