

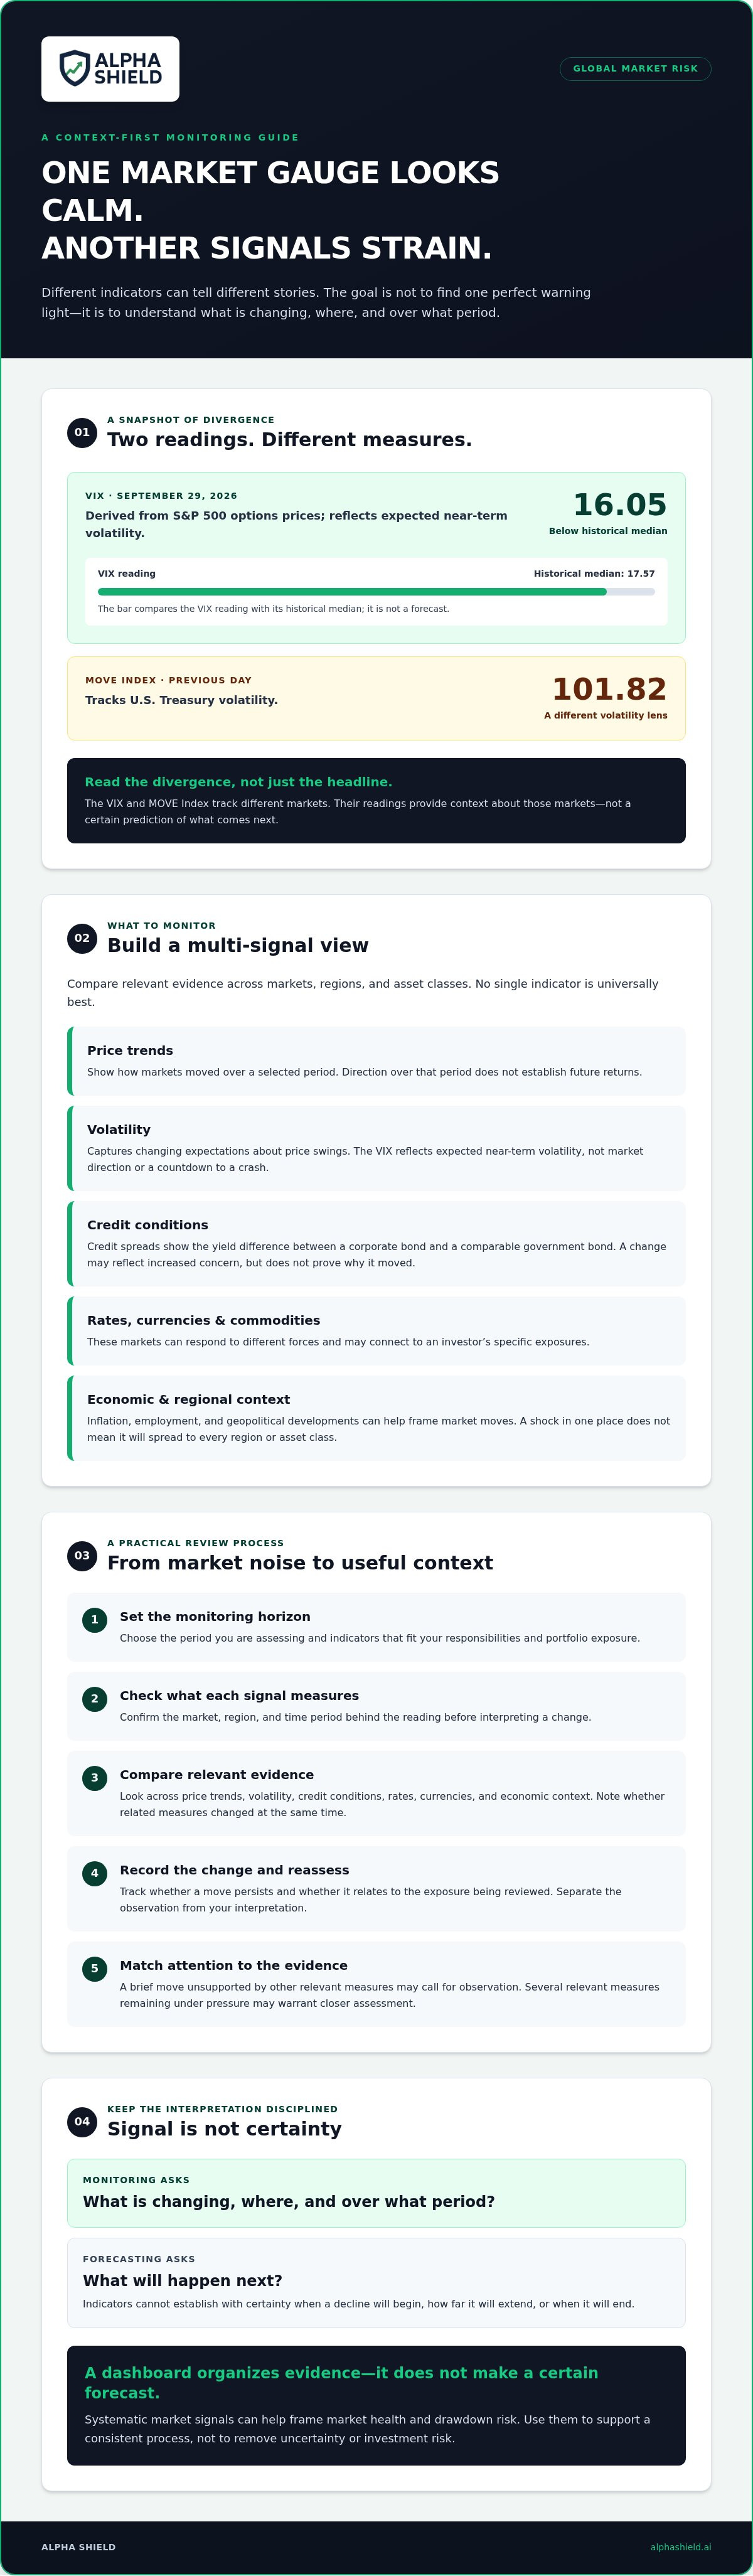
What if one market gauge looks calm while another signals strain? On September 29, 2026, the VIX stood at 16.05, below its historical median of 17.57. The previous day, the MOVE Index, which tracks U.S. Treasury volatility, closed at 101.82. That divergence shows why global market risk monitoring can’t rely on a single chart or headline.
When indicators move in different directions, it’s easy to lose sight of what matters to a portfolio. Headlines can make every shift feel urgent, while a brief burst of volatility can be mistaken for a lasting trend. A signal offers context, not certainty. Before interpreting a change, check what the indicator measures, the period it covers, and whether it relates to the exposure you are assessing.
This article explains how to monitor risk across markets and regions without treating any indicator as a reliable forecast. You’ll learn which signals can help frame changing conditions, how trend analysis can distinguish persistent pressure from short-lived volatility, and where interpretation has clear limits. You’ll also find a practical way to organize market information so decisions are guided by context and process, not noise.
Key Takeaways
- Use global market risk monitoring to bring indicators across regions and asset classes into a shared context, rather than reacting to headlines in isolation.
- Compare price trends, volatility, credit conditions, rates, currencies, and economic context over time. No single indicator is universally best.
- Set a monitoring horizon and choose indicators that match your responsibilities before interpreting changes or deciding what deserves attention.
- Record shifts and reassess them against broader market conditions to help distinguish persistent trends from short-lived noise.
- A systematic market signal and dashboard can help organize information about market health and drawdown risk, but neither makes a certain forecast.
What Global Market Risk Monitoring Tracks, and Why It Matters
Global market risk monitoring is the ongoing review of indicators across markets, regions, and asset classes to understand how changing conditions may affect investment risk. It is a process for organizing evidence, not a search for one warning light. Global market risk monitoring tracks changing conditions to inform risk assessment, but it cannot reliably predict exact market tops, bottoms, or crash timing.
The scope is broad because market exposures can respond to different forces. Market risk includes changes in equity prices, interest rates, currencies, and commodities. A monitoring framework may also consider credit risk, which relates to borrowers’ ability to meet obligations; liquidity risk, which concerns the ability to trade without materially affecting price; and geopolitical risks that may alter economic or financial conditions.
Which risks can global market monitoring help investors observe?
These risks are distinct, but they can interact. A geopolitical event could disrupt energy supply and move commodity prices. Depending on an investor’s exposures, that may prompt a check of related currencies, interest rates, or credit conditions. It does not mean the shock will spread to every region or asset class. Monitoring means checking for relevant connections rather than assuming them.
The practical question is whether a change appears isolated or may matter more broadly. For example, if a currency weakens after a policy announcement, an investor might compare that move with local bond yields and equity trends. They can note whether those measures moved at the same time, whether the moves persisted, and whether they relate to the exposure being reviewed. This provides more context than the headline alone, without proving a cause.
Monitoring, forecasting, and reacting are not the same
Monitoring asks: What is changing, where, and over what period? Forecasting asks what will happen next. A rise in volatility or a shift in credit conditions may indicate stress, but it does not specify the future path of markets. No indicator can establish with certainty when a decline will begin, how far it will extend, or when it will end.
Reactive decisions can give too much weight to a dramatic headline or a sharp move over a short period. A structured review creates space to check the signal against other evidence and the investor’s time horizon. If a move is brief and unsupported by other relevant measures, it may call for observation rather than an immediate change. If several relevant measures shift and remain under pressure, the conditions may warrant closer assessment.
Indicators inform risk assessment. They don’t remove uncertainty or investment risk. The discipline lies in tracking changes consistently, asking whether they matter to the portfolio, and resisting the temptation to treat any single reading as a certain forecast. A useful review separates the observed change from the interpretation and records what evidence would prompt another look.
How Global Market Risk Signals Reveal Changing Market Conditions
A useful monitoring framework combines different kinds of evidence. Price trends show how markets have moved over a selected period. Volatility gauges capture changing expectations about price swings. Credit spreads can show whether investors are demanding more compensation for credit risk. Macroeconomic data, such as inflation and employment, can help explain the conditions surrounding market moves.
Each measure is an observation. Interpretation is a separate judgment. A wider credit spread, for example, shows a change in the yield difference between a corporate bond and a comparable government bond. It may reflect increased concern about credit risk, but the reading alone doesn’t establish why the spread moved or what will happen next. Check the period being compared and whether other indicators show a related change before drawing a broader conclusion.
What volatility, credit, and trend indicators can show
The VIX is derived from S&P 500 options prices and reflects expected volatility over the near term. It measures the market’s implied expectation of price movement, not its direction. It isn’t a countdown to a crash. A higher reading may indicate greater expected volatility, but it can’t determine whether markets will fall or when.
Price trends add another lens. An index rising or falling over a chosen period describes its direction during that period, not future returns. Comparing a short-term move with a longer-term trend can help put recent activity in proportion. When comparing trends, keep the period consistent and note whether the move is continuing, reversing, or fluctuating. Credit spreads and volatility can then show whether financing conditions or expectations are changing alongside prices.
Why macroeconomic and cross-market context matters
Signals become more informative when compared across time and asset classes. A rise in Treasury yields, for instance, may coincide with currency shifts and changing equity conditions. Together, these observations can help frame whether markets are responding to interest-rate expectations, growth concerns, or another factor. They don’t prove a single cause. The Federal Reserve influences financial conditions through monetary policy, but it doesn’t determine every market move.
The Bank for International Settlements examines how international banking and financial markets connect across borders. Those linkages are a reason to check whether a change in one market is also visible elsewhere, not to assume every shock will spread. Policy research from Boston University also considers tools that can prevent and mitigate financial crises, underscoring the value of assessing conditions in context.
A cluster of indicators can provide a more grounded view of changing market conditions, but it cannot guarantee a forecast or remove uncertainty. That distinction is central to global market risk monitoring: evidence helps structure assessment; it doesn’t settle what happens next.
For readers who want a dedicated way to organize information about market health and drawdown risk, the Alpha Shield market signal and dashboard can be considered as one part of a broader monitoring process.
How to Compare Global Risk Indicators Without Mistaking Noise for a Warning
Indicators answer different questions. Comparing them helps clarify whether a market move is isolated, persistent, or relevant to other exposures. The aim of global market risk monitoring isn’t to crown one measure as the best, but to understand what each can and can’t show. For a useful comparison, look at the measure’s purpose, time horizon, relationship to the exposure, and limits. Then ask whether the observation is supported by other relevant evidence.
| Indicator | What it measures | Typical horizon | Main limitation |
|---|---|---|---|
| Implied volatility | Options-market expectations of potential price swings | Near term, depending on the measure | Doesn’t indicate the direction or timing of a market move |
| Credit spreads | The additional yield on riskier debt compared with a reference bond | Current pricing, reviewed over time | Can move for several reasons and doesn’t identify a cause by itself |
| Government yields | Bond-market pricing of borrowing costs and expectations | Immediate market pricing and longer-term trends | May reflect changing expectations, supply, demand, or other forces |
| Currencies | The relative value of one currency against another | Short- and longer-term movements | A currency move can reflect factors specific to either side of the exchange rate |
| Market trends | Observed direction and persistence in asset prices | Whatever period is selected | Results depend on the chosen window and don’t establish future returns |
| Macroeconomic data | Reported conditions such as inflation, employment, or growth | Usually periodic and backward-looking | Release timing and later revisions can affect interpretation |
What different indicator groups measure
Volatility measures are market-implied: they reflect expectations embedded in options prices. Price trends record what has already happened. Macroeconomic data describe reported economic conditions, often on a set release schedule. Credit spreads and government yields add information about debt markets, which may behave differently from equity indexes. The U.S. Office of Financial Research provides a range of financial system monitoring tools that illustrate how distinct measures can contribute to a broader view.
For a deeper reference on indicator types and interpretation, see this guide to macro market risk indicators.
Common interpretation errors in risk monitoring
A move may matter more when it persists, appears across relevant markets, or aligns with other evidence. The same move may be noise if it reverses quickly or has little connection to the exposure being assessed. Correlation is not proof of causation: two markets moving together doesn’t establish that one caused the other.
Time windows matter, too. A short sample may make an indicator look unusually dependable, while a longer period tells a different story. Compare consistent intervals and record conflicting signals rather than forcing them into one conclusion. If equity volatility rises while credit spreads remain stable, report both observations and consider their relevance. Don’t treat disagreement as certainty, or as a reason to ignore either measure. Also avoid comparing readings with different definitions or timeframes as if they were equivalent.
A Practical Process for Monitoring Global Market Risk Over Time
A repeatable routine makes global market risk monitoring more useful and less reactive. The goal is not to check every market constantly. It’s to define what you need to observe, review it consistently, and keep a record that separates new information from changing interpretation. Before adding a measure, identify the question it helps answer and the portfolio exposure or responsibility that makes it relevant.
Build a monitoring routine around a defined horizon
Start by setting the time horizon. Short-term market conditions can change quickly, while long-term investment objectives may depend on broader patterns. Choose a review cadence that fits your responsibilities and the information available. Checking more often doesn’t automatically improve decisions.
Next, select a manageable set of indicators. For each one, write down why it belongs in the process and what it can help you observe. For example, you might use a price trend to track direction over a defined period, volatility to monitor expected price swings, and credit spreads to follow debt-market pricing. A measure without a clear purpose can add noise rather than clarity. Revisit the selection if your time horizon, responsibilities, or relevant exposures change.
Make comparisons consistent: use the same indicator definition and comparison period when reviewing changes, and note when data are released or revised. If two measures conflict, preserve the disagreement in your notes instead of combining them into a single unqualified judgment. This makes it easier to see whether later information confirms, weakens, or changes the initial interpretation.
Turn observations into documented risk context
A dated log helps show whether a signal persists or reverses. Keep each entry concise and consistent. Include:
- Indicator and observation date: Identify what you reviewed and when.
- Comparison period: Note the timeframe used to judge the change.
- Context: Record relevant market or economic developments without assuming they caused the move.
- Interpretation and uncertainty: State whether signals agree, conflict, or have changed direction, and note what remains unclear.
At the next scheduled review, compare the new entry with earlier observations. A move that reverses may have been brief; one that persists across review points may deserve further assessment. The log doesn’t prove what will happen next. It makes the reasoning behind your assessment easier to examine and less vulnerable to hindsight.
Keep monitoring separate from action. This article describes a process for organizing and reviewing information, not a prescription for buying, selling, or changing a portfolio. For a discussion of rules-based exit considerations, see this rules-based stock market exit guide. It offers a related perspective, but it doesn’t determine what any individual should do.
Monitoring supports analysis; it is not individualized financial advice and cannot remove investment risk. Use the process to clarify what you observe and what remains uncertain, then seek advice suited to your circumstances when needed.
Where a Systematic Market Signal Fits in Global Risk Monitoring
A monitoring process can involve several indicators, notes, and review periods. A dedicated dashboard can help organize market risk information in one place, making it easier to refer to a systematic signal alongside a broader assessment. It doesn’t replace the context checks described earlier. Its role is to support a consistent review, not to turn complex market conditions into certainty.
What a dashboard can simplify, and what it cannot decide
The Alpha Shield Market Signal and Alpha Shield Dashboard are designed for monitoring market health and drawdown risk. The signal offers a systematic reference point within a wider monitoring process. Investors still need to consider their own time horizon, exposures, and other relevant information. A dashboard cannot determine what every market move means for a particular portfolio.
That distinction matters. A signal is not a complete investment plan or personalized financial advice. It can’t eliminate market uncertainty, guarantee protection from losses, or predict every downturn. Nor is Alpha Shield a day-trading tool, shorting strategy, or source of individual stock recommendations. Its stated scope is systematic market risk monitoring and drawdown risk, not decisions outside that purpose.
Evaluate any market risk signal with disciplined questions
Before relying on a signal, ask clear questions. What condition is it intended to monitor? What time horizon does it address? What information does it provide, and what remains uncertain? Which decisions fall outside its stated purpose? These questions help keep the signal in proportion and prevent a single reading from taking the place of independent judgment.
Also assess whether the system’s stated scope and limitations are clear, and whether it fits your monitoring needs. If you can’t explain what a signal is meant to indicate, or how it fits alongside other evidence, treat it cautiously. A systematic measure may help reduce headline-driven interpretation, but it doesn’t remove the need to understand its role and limitations.
The same discipline applies to the dashboard itself. Use it as an organizing reference within your process, not as a standalone instruction to act. Review its information alongside the indicators, context, and documentation that matter to your own responsibilities. The objective is clarity, not certainty.
If you’d like to review the tool’s stated scope for yourself, explore Alpha Shield Market Signal.
Build a More Disciplined Market Monitoring Practice
Effective global market risk monitoring is a process, not a prediction. Compare indicators across asset classes and timeframes, check market context, and record what changes. A cluster of signals can sharpen risk assessment, but no single measure can identify a certain market outcome or remove investment risk.
A consistent routine also helps separate short-lived fluctuations from conditions that persist. Define what matters to your horizon, note conflicting evidence, and avoid letting headlines dictate the review. The objective is clearer judgment, not certainty.
Alpha Shield focuses on systematic market signals and capital preservation, not day trading or stock picks. Its founders bring more than 50 years of combined experience in investment banking and global markets. System development began in 2017, and Alpha Shield launched in 2019. Its signal and dashboard are intended to support market-health and drawdown-risk monitoring, not guarantee protection from losses.
With clear limits and a repeatable process, you can approach changing markets with greater discipline and steadier perspective.
Frequently Asked Questions
What is global market risk monitoring?
Global market risk monitoring is the ongoing review of indicators across regions and asset classes to understand changing financial conditions. It may include volatility, credit spreads, interest rates, currencies, and price trends. The purpose is to add context to risk assessment, not to predict every market move. No monitoring process can remove uncertainty, guarantee that an investor avoids losses, or determine with certainty when a downturn will begin or end.
Which indicators are used to monitor global market risk?
Common indicators include volatility measures such as the VIX, credit spreads, government bond yields, currency movements, and broad market trends. Each measures a different aspect of market conditions and has limitations. For example, an equity index tracks stock prices, while a government yield reflects bond-market pricing. A useful framework identifies what each indicator measures, its relevant horizon, and why it belongs in the review.
Can global market risk indicators predict a market crash?
No indicator can reliably identify every crash in advance. Measures may signal changing conditions or rising stress, but they can also give false alarms, lag events, or conflict with one another. Their value is in supporting systematic observation and a decision framework. Treat readings as evidence to assess, not certain forecasts or guarantees. Indicators also aren’t substitutes for a complete investment plan tailored to an investor’s circumstances.
How often should investors monitor global market risk?
The right review frequency depends on an investor’s time horizon, responsibilities, and monitoring process. Frequent checking isn’t automatically better and may draw attention toward short-term noise. A consistent schedule makes observations easier to compare. Record the date, comparison period, and relevant context for meaningful changes. Avoid changing the monitoring process solely because of a dramatic headline or one isolated data point; reassess according to the schedule and criteria you’ve set.
What is the difference between market risk monitoring and market timing?
Monitoring means observing and interpreting market conditions. Market timing means deciding when to change market exposure based on expectations or defined rules. Monitoring can inform a decision framework, but it isn’t itself a complete timing strategy and doesn’t prescribe portfolio actions. Neither process guarantees a successful outcome. Before using a signal, clarify what it is designed to monitor, what decisions it may inform, and which decisions fall outside its stated purpose.
Can one dashboard monitor risk across all global markets?
Not necessarily. A dashboard can organize selected indicators, but its coverage depends on the data and features it actually provides. Don’t assume one tool includes every market, region, or risk factor. Check what it monitors and understand its limitations. The Alpha Shield Dashboard presents a systematic market signal for monitoring market health and drawdown risk. It doesn’t eliminate uncertainty, replace sound judgment, or provide individualized financial advice.
How is a systematic market signal different from financial news alerts?
News alerts report events or developments, while a systematic market signal applies a defined process to market information. News can provide event context; a signal can offer a structured reference for ongoing risk monitoring. They serve different purposes, and neither is infallible. Before relying on a signal, check what it is intended to monitor, what its limitations are, and what it doesn’t claim to do. A signal is not an individual stock recommendation.


