

A market can rise while economic data weakens, volatility climbs, and investor sentiment turns cautious. That conflict doesn’t mean the signals are useless. It shows why market cycle indicators for investors are best read as context, not as reliable forecasts of turning points.
If you’ve found it difficult to tell whether an indicator reflects the economy, price trends, volatility, or sentiment, you’re not alone. These measures can lag, disagree, or react to short-term noise. Relying on one signal can create confidence that the evidence doesn’t support.
This guide explains the common phases of market cycles and what different indicator categories can and can’t tell you. You’ll learn how to compare economic, price, volatility, and sentiment measures without treating any one of them as a prediction. Then you’ll see how to build a consistent monitoring approach that keeps long-term objectives in view. The goal isn’t to call exact market tops or bottoms. It’s to use evidence with discipline, recognize uncertainty, and make clearer decisions about risk.
Key Takeaways
- Market cycles describe shifting conditions, not a fixed sequence investors can time precisely.
- Compare price, volatility, breadth, credit, and economic indicators by what they measure and where their limits lie.
- When signals conflict, consider differences in timing and scope before drawing conclusions about market conditions.
- Build a repeatable review process: define your objective, select relevant measures, set a cadence, and record uncertainty.
- Use market cycle indicators for investors as context within a risk-management process, not as standalone forecasts or individualized investment advice.
What Market Cycles Mean for Investors, and What Indicators Can Show
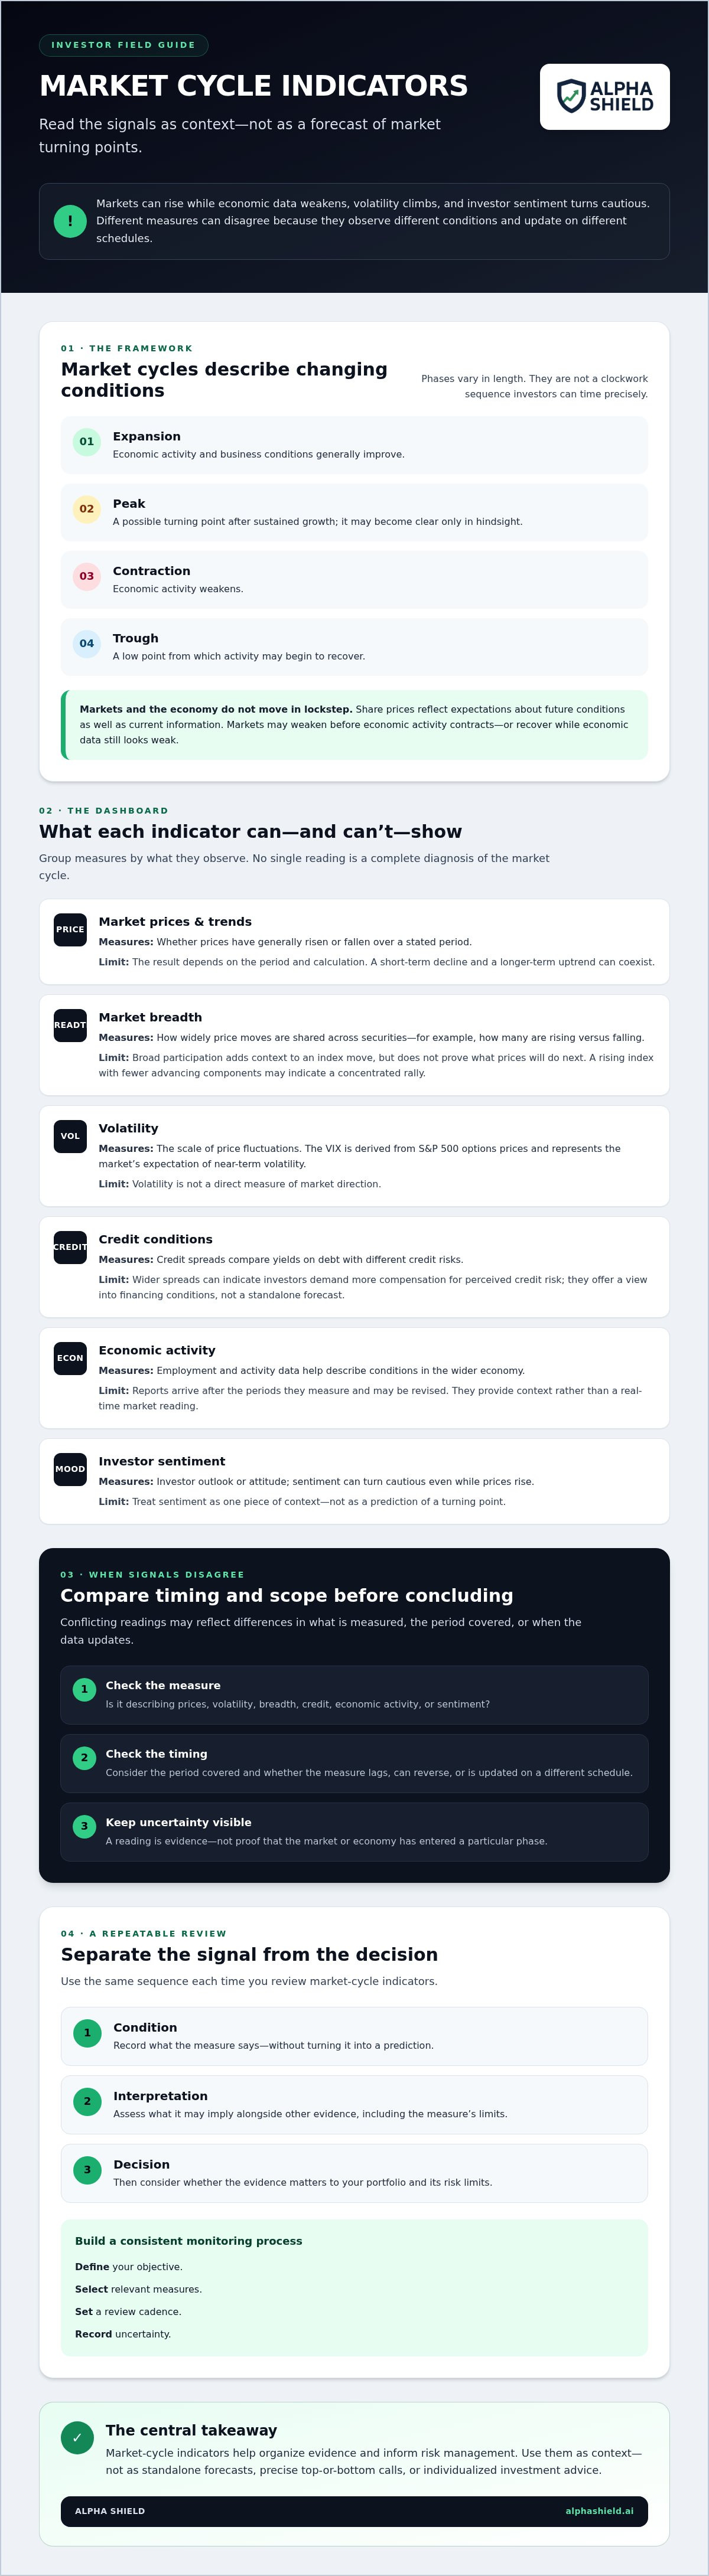
Market cycles describe shifts in economic activity and financial-market conditions over time. They aren’t clockwork sequences: phases vary in length, and investors can’t confirm every transition as it happens. A useful framework helps organize evidence, but it doesn’t provide a schedule for when markets will turn.
A market-cycle indicator is a measure of an observable condition, such as price behavior, volatility, or economic activity, that may help investors assess the environment. It is not a guaranteed forecast. The reading is evidence; what it means and how to respond are separate judgments.
How investors describe the main phases of a market cycle
Expansion generally involves growing economic activity and improving business conditions. A peak marks a possible turning point after growth has been sustained, though it may only become clear in hindsight. During contraction, economic activity weakens. A trough marks a low point from which activity may begin to recover. These labels describe broad patterns, not fixed dates or rules that every cycle must follow. For an overview of the economic framework, see Business cycles.
Business-cycle conditions and stock-market performance don’t move in lockstep. Share prices reflect expectations about future conditions as well as current information, so markets may weaken before economic activity contracts or recover while economic data still looks weak. The National Bureau of Economic Research (NBER) dates U.S. business-cycle peaks and troughs retrospectively. Its chronology helps describe past economic cycles; it isn’t a live signal confirming the current phase.
What a market-cycle indicator can and cannot tell you
An indicator can show what a selected measure is doing over a defined period. For example, a price measure describes market performance, while a volatility measure captures the scale of price fluctuations. Neither one, by itself, proves that the economy or market has entered a particular phase. Readings can lag, reverse, or conflict because they measure different conditions and update on different schedules.
Keep three steps distinct: condition, interpretation, decision. First, record what the measure says. Then assess what it may imply alongside other evidence. Only after that should you consider whether it matters to your portfolio and its risk limits. This separation helps prevent a single data point from becoming a forecast or an automatic instruction. For more on evaluating systematic measures, see this institutional-grade investment signals guide.
Used this way, market cycle indicators for investors provide structured context, not certainty. Their value depends on understanding what each one measures and where its limits begin.
The Main Market Cycle Indicators Investors Can Monitor
Each indicator describes a different part of the market or economy. Grouping them by what they observe makes comparisons more useful and reduces the temptation to treat one reading as a complete cycle diagnosis.
- Market prices: Trend measures summarize whether prices have generally risen or fallen over a stated period. The result depends on the period and calculation used, so a short-term decline and a longer-term uptrend can coexist.
- Market breadth: Breadth tracks how widely price moves are shared across securities, such as how many are rising versus falling. Broad participation can add context to an index move, but it doesn’t prove what prices will do next.
- Volatility: Volatility measures the scale of price fluctuations. The VIX is derived from S&P 500 options prices and represents the market’s expectation of near-term volatility. It is not a direct measure of market direction.
- Credit conditions: Credit spreads compare yields on debt with different credit risks. Wider spreads can indicate that investors demand more compensation for perceived credit risk, offering a view into financing conditions.
- Economic activity: Employment and activity data help describe conditions in the wider economy. These reports arrive after the periods they measure and may be revised, so they provide context rather than a real-time market reading.
Price trends, market breadth, and volatility
Trend measures answer a narrow question: what has the market done over a specified window? Breadth adds a participation check. If an index rises while fewer of its component securities advance, the rally may be concentrated. That observation describes market structure, not a reliable reversal signal. The VIX adds another distinct view by reflecting options-market expectations of near-term S&P 500 volatility. It doesn’t say whether prices will rise or fall.
Credit conditions, yield curves, and economic data
Credit spreads can widen when perceived default risk or the cost of financing rises, but they can also move for other reasons. A yield curve compares interest rates across bond maturities. Its shape can offer economic context, yet it isn’t a precise tool for timing a recession or market turn.
Employment and activity reports help investors assess whether economic conditions are strengthening or weakening. Their publication lag and possible revisions matter: the first reported reading may not be the final one. Check the release period and methodology before comparing it with market data.
Different indicator types provide different perspectives, not multiple votes on a single forecast. For market cycle indicators for investors, interpretation depends on timeframe, calculation method, and the question being asked. If you want a structured view of market-health conditions, the Alpha Shield Dashboard presents indicators for risk management.
How to Read Conflicting Indicators Without Calling a Market Top
Indicators often disagree because they measure different conditions on different schedules. A price decline, rising volatility, and steady employment data can all be accurate at the same time. The readings aren’t necessarily contradictory; they may describe distinct parts of the market and economy.
Indicators describe conditions; they don’t guarantee outcomes. No single warning signal can confirm an exact cycle turning point. Even a measure often described as “leading” can produce false alarms or arrive too early to guide a specific decision.
| Indicator category | What it measures | Likely lag | Key limitation |
|---|---|---|---|
| Market prices | Price direction over a selected period | Reflects current trading, but turns can be recognized after they begin | Price moves don’t explain their own cause |
| Volatility | Scale of expected or observed price fluctuations | Can change quickly with market conditions | Elevated volatility doesn’t establish direction or a lasting regime shift |
| Economic activity | Output, employment, and related conditions | Often reported after the period measured | Data may be revised and can lag market expectations |
| Credit conditions | Perceived credit risk and financing conditions | Varies by measure and reporting frequency | Spreads can move for reasons beyond the economic cycle |
| Market breadth | How widely price moves are shared across securities | Updates with market prices | Participation describes market structure, not what comes next |
Why market indicators sometimes disagree or arrive late
Analysts often classify indicators as leading, coincident, or lagging. These labels describe typical relationships to economic activity, not guarantees about timing. A leading measure may weaken before the economy does, while a lagging measure may confirm deterioration only after it is underway.
Measurement windows matter, too. Prices react to expectations about future conditions; economic reports describe activity over a past period and may later be revised. A market decline could reflect changing rate expectations, weaker earnings outlooks, or temporary uncertainty. One move alone doesn’t identify which explanation is correct or prove that the cycle has shifted.
A framework for weighing evidence instead of chasing predictions
Before assigning meaning to a reading, check four things: its source and calculation, the period it covers, how consistently it has behaved, and whether it answers your investment question. Then look for persistence and confirmation across categories. If one measure changes while related evidence remains steady, record the difference rather than forcing a conclusion.
This disciplined approach helps investors use market cycle indicators for investors as evidence to assess, not instructions to follow. For a deeper quantitative discussion, see the macro market risk indicators guide.
A Practical Market-Cycle Monitoring Process for Long-Term Investors
A monitoring process should make market information easier to assess, not create pressure to react to every new reading. For long-term investors, consistency matters more than building the largest possible watchlist. Use a repeatable sequence and keep observation separate from portfolio action.
Set up a consistent indicator watchlist
Choose a small, complementary set of measures that address your objective. For example, you might track a broad price trend, a measure of market participation, a credit-condition measure, and selected economic data. The aim isn’t to collect every available signal. It’s to cover distinct areas without duplicating the same information.
For each measure, note its source, update frequency, timeframe, and known limitations. Keep that reference beside the reading. Avoid adding indicators solely because a headline makes them seem urgent; changing the watchlist in response to noise makes comparisons less consistent.
Turn observations into disciplined review, not reactive trading
Use this process at a cadence that fits your investment horizon and the frequency of the data. A scheduled review might follow these steps:
- Define the objective. State what you want the monitoring process to inform, such as understanding broad market risk in relation to your long-term plan.
- Choose the indicators. Select measures that answer that question from different angles, and document their sources and limitations.
- Set a review cadence. Decide when you’ll review each measure. A cadence matched to the data’s update schedule helps prevent daily price movement from dominating slower-moving economic information.
- Document the readings. Record what changed, your interpretation, how certain you are, and at least one plausible alternative explanation.
- Set the next review point. Note what evidence could change your interpretation and when you’ll assess it again.
Then compare the observations with your stated objectives, time horizon, and risk tolerance. Monitoring doesn’t dictate a portfolio decision. Any action should reflect your circumstances and risk plan, not a universal allocation, exit threshold, or isolated signal. A rules-based framework can help clarify how investors think about decisions; see this rules-based stock-market exit guide.
Applied consistently, market cycle indicators for investors can support a measured review rather than reactive trading. The record also gives you a way to distinguish a genuine change in evidence from a change in your interpretation.
Where Systematic Market Signals Fit Into a Cycle-Aware Process
A systematic market signal can condense defined market conditions into a consistent reading for an investor’s risk-management process. It may make monitoring more orderly, but it doesn’t replace the investor’s objectives, judgment, or portfolio plan. Treat the signal as one input, not a command to buy or sell.
That distinction matters. A dashboard can support decisions by presenting market information in a structured way. It isn’t individualized financial advice, and a market-level signal isn’t an assessment of whether a particular security belongs in your portfolio. No signal removes investment risk or guarantees protection from losses.
What to evaluate in a market-signal dashboard
Before relying on a tool, understand what it measures and how its outputs should be interpreted. Check how often readings update, what timeframes they represent, and whether the methodology and limitations are explained clearly. Historical context can help you understand how a signal has behaved across different conditions, but it doesn’t guarantee the same result in the future.
Fit matters, too. A tool intended to inform long-term risk monitoring serves a different purpose from one designed for frequent trading. The most useful dashboard is one you can assess consistently within your process, without treating each change as an automatic portfolio instruction.
How Alpha Shield relates to market-cycle monitoring
Alpha Shield provides a systematic market signal and dashboard for investors managing market risk and significant drawdowns. The dashboard presents market-health indicators for risk management. Used alongside other market cycle indicators for investors, that information can contribute context to an investor-defined process. It doesn’t forecast exact turning points or determine what an individual should own.
Alpha Shield doesn’t provide individual stock picks, shorting strategies, or day-trading tools. Its role is narrower: to offer a systematic market signal and dashboard as potential inputs to long-term risk monitoring. As with any tool, review its stated measures, update schedule, methodology, and limitations before deciding whether it fits your approach.
If that framework aligns with your monitoring needs, Explore the Alpha Shield Market Signal.
Build a Steadier Market-Monitoring Habit
Market cycles aren’t a timetable, and indicators can’t pinpoint every turn. Their value is in providing context. Compare measures that track different conditions, account for timing and limitations, and record uncertainty instead of treating one reading as a forecast.
A consistent review process helps turn market cycle indicators for investors into useful inputs for long-term risk management. Define what you’re monitoring, choose a focused set of measures, and review them on a schedule that fits your objectives. Keep observation separate from action, and base portfolio decisions on your circumstances and risk plan.
For investors who want a systematic source of market context, Alpha Shield offers a Market Signal and dashboard for risk management. Development began in 2017, and Alpha Shield launched in 2019. Its founders bring more than 50 years of combined investment-banking and global-markets experience. A signal can inform a process, but it can’t remove investment risk or guarantee protection from losses.
Stay focused on the process, not the noise. A measured, repeatable approach can help you assess changing conditions with greater clarity.
Frequently Asked Questions
How do investors identify the current market cycle?
Investors assess current market conditions by comparing several measures, not by relying on a single cycle label. Market cycle indicators for investors can include price trends, volatility, breadth, credit conditions, and economic activity. Check what each measure tracks, its timeframe, and how often it updates. Then record the reading, your interpretation, and the uncertainty. A label such as expansion or contraction describes an assessment of conditions, not a forecast of the next market move.
Which indicators are most useful for understanding market cycles?
No single indicator is best for every question or timeframe. Price trends and breadth describe market behavior, while volatility reflects expected near-term fluctuations. Credit measures add context about perceived risk and financing conditions; economic data helps describe broader activity. Choose complementary measures that each provide a distinct perspective. Before using one, check what it measures, how often it updates, and whether it tends to lead, coincide with, or lag the conditions you’re assessing.
Can market-cycle indicators predict a market crash?
Market-cycle indicators can highlight changing conditions or elevated risk, but they can’t reliably predict the exact timing or scale of a crash. Some measures lag; others may give false signals or change as new information arrives. Treat them as inputs to a risk-management process, not as guarantees, precise forecasts, or instructions to trade immediately. A disciplined response considers multiple readings and your investment plan rather than assuming that one warning signal confirms what will happen next.
What is the difference between a leading and a lagging indicator?
A leading indicator is intended to change before a broader economic or market condition, while a lagging indicator tends to confirm a change after it has occurred. These terms describe timing tendencies, not certainty. A leading measure can give false signals; a lagging measure can still help confirm a developing pattern. To interpret either one, check its source, update schedule, measurement period, and the context around its latest reading.
How often should investors review market-cycle indicators?
Review indicators on a consistent schedule that fits their update frequency and your investment horizon. Checking daily can amplify noise if the underlying data changes slowly or is published periodically. At each review, record the date, reading, interpretation, and uncertainty, then compare it with earlier observations. Avoid changing a long-term plan solely because one measure moved. A predefined review process helps keep attention on sustained evidence and your personal circumstances.
Do market indicators give the same signal at the same time?
No. Indicators measure different conditions over different timeframes. Market prices can react quickly to expectations, while economic releases may describe an earlier period and can be revised. Volatility, breadth, and credit measures add still other perspectives. Compare each indicator’s definition, timing, and limitations. Look for persistent evidence across categories, but don’t force conflicting readings into one confident conclusion. Disagreement may reflect different data windows rather than a clear change in the cycle.
Can a market-cycle indicator tell me when to sell investments?
An indicator alone can’t determine whether you should sell. That decision depends on your goals, time horizon, liquidity needs, risk tolerance, and investment plan. Market-cycle measures may provide context, but they aren’t individualized financial advice and can’t guarantee a better result. Define decision rules in advance rather than reacting to an isolated reading. If you need guidance tailored to your circumstances, consider consulting a qualified financial professional.


