
What if the most alarming market signal isn’t the most useful one? Investors can track dozens of metrics, but a single spike in volatility or a sharp price decline doesn’t explain the full risk picture. Useful portfolio safety indicators work together, with each reading interpreted in context.
If you’ve ever wondered whether a market move calls for attention or simply adds noise, that uncertainty is understandable. Reacting to one data point can turn routine fluctuations into emotional decisions. A consistent review offers a steadier alternative.
This article explains which market and portfolio indicators can help you assess risk, how to read signals together, and how to build a practical monitoring routine. You’ll review measures such as volatility, market breadth, interest rates, and portfolio drawdowns, then consider what their combined movement may suggest. These indicators can inform a review, but they can’t guarantee what markets will do next. The aim is clarity and discipline, not prediction.
Key Takeaways
- Separate risks within your portfolio, such as concentration, from signals about broader market conditions.
- Review portfolio safety indicators across categories such as trend, volatility, breadth, and liquidity rather than relying on one reading.
- When signals conflict, consider their time horizons and how they’re constructed before deciding what they may indicate.
- Build a repeatable review that starts with your portfolio exposures, then records relevant market conditions and changes.
- A dashboard can help organize monitoring, but neither a signal nor a tool guarantees protection from losses or drawdowns.
What Portfolio Safety Indicators Can and Cannot Tell You
Portfolio safety indicators help assess two related but distinct things: the risks built into a portfolio and conditions affecting the broader market. They can help investors identify concentrated exposures or changes in market behavior. They can’t certify that a portfolio is safe, guarantee against losses, or reliably forecast every decline.
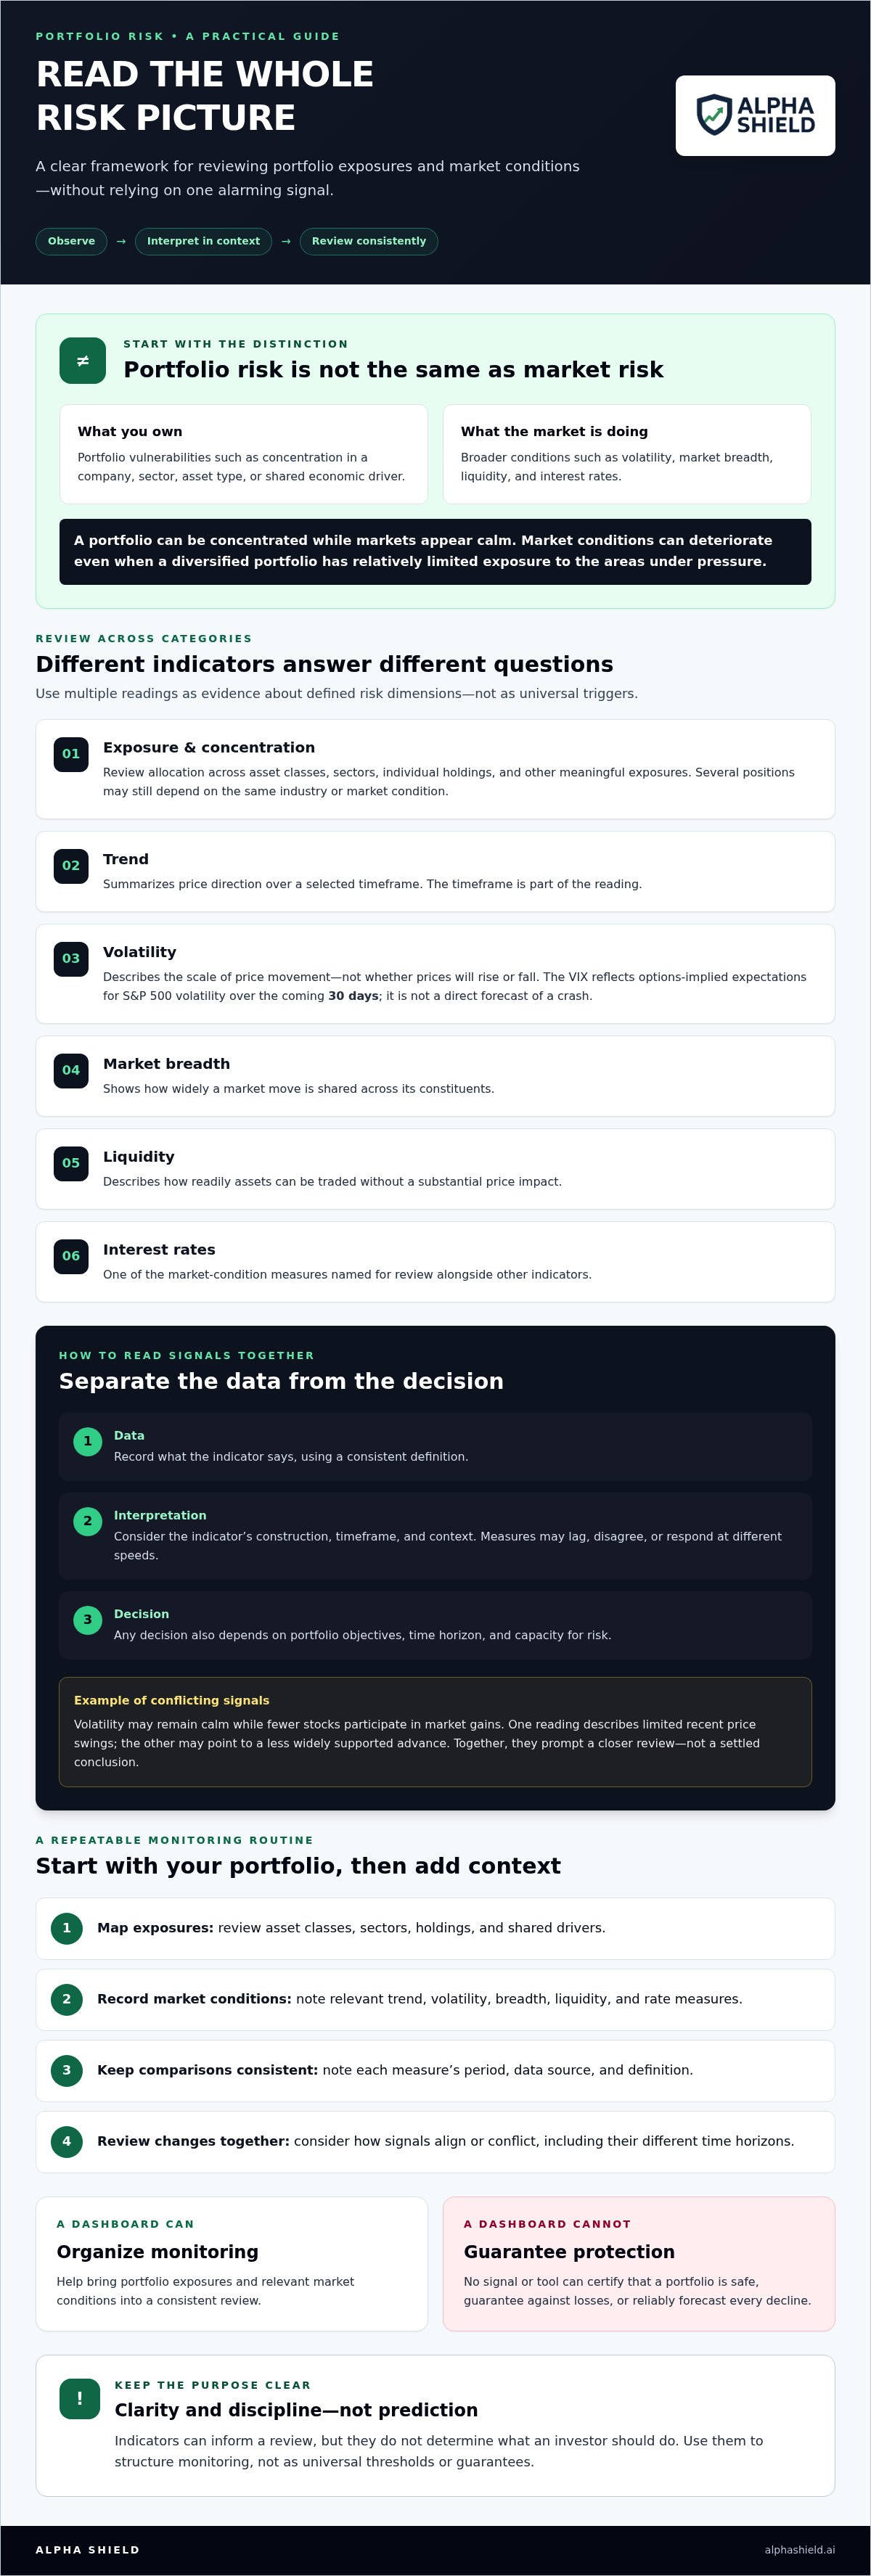
Portfolio-level vulnerabilities include heavy concentration in a single company, sector, or asset type. Broader market indicators describe conditions that may affect many investments, such as volatility, market breadth, or liquidity. A portfolio can have concentrated exposure even when the market appears calm. Conversely, market conditions can deteriorate while a diversified portfolio has relatively limited exposure to the areas under pressure.
This distinction reflects the wider discipline of financial risk management, which involves identifying and assessing different types of risk rather than relying on one measurement. The purpose here is educational: to help long-term investors structure a monitoring process, not to provide personalized investment advice or specific buy-and-sell instructions.
What makes an indicator useful for portfolio monitoring?
A useful indicator provides evidence about a defined risk dimension. For example, concentration analysis can show how much a portfolio depends on a small number of holdings, while a volatility measure describes how sharply prices have moved over a specified period. Neither observation, by itself, determines what an investor should do.
Keep three steps separate: the data, its interpretation, and any decision that follows. A reading is an observation. Interpreting it requires context, including the indicator’s timeframe and calculation. A decision also depends on the portfolio’s objectives, time horizon, and capacity for risk. Use consistent definitions when reviewing a measure. Changing the period or calculation can make comparisons misleading.
Why one metric cannot certify portfolio safety
Indicators can lag, disagree, or respond at different speeds. A measure based on recent price movement may change quickly, while other evidence of market participation develops more gradually. Conditions also evolve, so a reading that was informative in one period may carry a different meaning as the market changes.
Consider a hypothetical case: volatility remains calm, but fewer stocks are participating in market gains. The volatility reading may indicate that recent price swings are limited, while weakening breadth may suggest that the advance is becoming less widely supported. Neither signal settles the question alone. Together, they prompt a closer review of market conditions and portfolio exposure.
No single indicator guarantees protection from losses. A disciplined review uses multiple signals in context. The next step is to examine those signals by risk category, without treating any one reading as a universal threshold.
Portfolio Safety Indicators to Review Across Market Conditions
A useful checklist covers both what you own and what the wider market is doing. These portfolio safety indicators address different risk dimensions. Review them together, but don’t treat any single reading as a universal trigger or threshold.
Portfolio exposure and concentration checks
Start with your portfolio’s allocation across asset classes, sectors, individual holdings, and other meaningful exposures. Look beyond the number of positions: several investments may still depend on the same industry, economic driver, or market condition. If one exposure dominates, a setback in that area could have an outsized effect on the portfolio.
Company fundamentals help assess an individual business. Portfolio-wide risk checks ask a different question: how might holdings behave together under changing market conditions? Both perspectives can matter, but one doesn’t replace the other.
Market trend, volatility, breadth, and liquidity signals
Trend measures summarize price direction over a selected timeframe. Volatility measures describe the scale of price movement, not whether prices will rise or fall. The VIX, for example, reflects options-implied expectations for S&P 500 volatility over the coming 30 days. It isn’t a direct forecast of a crash.
Breadth measures how widely a market move is shared across its constituents. Liquidity describes how readily assets can be traded without a substantial price impact. Each measure has limits, so note the period, data source, and definition used in your review. The Bureau of Labor Statistics discusses the use of data to evaluate financial information and risk in its overview of professional risk assessment.
An indicator records an input. Interpretation depends on its definition, timeframe, and portfolio context.
| Indicator | Question answered | Limitation | Review frequency |
|---|---|---|---|
| Portfolio concentration | Are a few holdings or related exposures driving risk? | Allocation alone doesn’t show how exposures may behave in stress. | At scheduled reviews and after portfolio changes. |
| Market trend | What direction have prices taken over the selected period? | Past direction doesn’t establish what comes next. | Use the same timeframe each review. |
| Volatility, including VIX | How much price movement is being priced or observed? | Volatility doesn’t predict direction or guarantee a decline. | Check alongside other market signals. |
| Market breadth | How many constituents are participating in the move? | Breadth depends on the market and measure selected. | Compare consistently over time. |
| Liquidity conditions | Could trading become more difficult or affect execution prices? | Liquidity varies by asset and market conditions. | Review when conditions or holdings change. |
Investors who want a structured way to organize market monitoring can explore the Alpha Shield Market Signal and Dashboard. A dashboard can support a repeatable review, but it doesn’t guarantee protection from losses.
How to Interpret Conflicting Portfolio Safety Indicators
Conflicting readings aren’t necessarily errors. Different measures capture different risks, use different data, and update on different schedules. Before treating a warning as meaningful, check what each indicator measures and whether it relates to your portfolio’s actual exposures.
| Signal pattern | What it may indicate | How to review it |
|---|---|---|
| Distinct indicators agree | Several risk dimensions may be deteriorating at once. | Check whether the measures use independent data and whether the change affects your portfolio. |
| Indicators conflict | Market conditions may be mixed, or measures may reflect different timeframes. | Verify definitions, periods, and relevant portfolio exposures before drawing a conclusion. |
| Indicators change at different speeds | A faster measure may react to recent conditions while a slower one still reflects older data. | Record when each measure updated and compare it with prior readings on the same basis. |
Confirmation is more informative when it comes from distinct categories, such as price trends and trading liquidity, than from several versions of similar price data. Multiple measures can appear to agree because they share the same underlying inputs. That is not the same as independent confirmation.
What should you do when indicators disagree?
Use a consistent review sequence. First, verify the underlying data and the period being measured. Then ask whether the signal applies to your holdings, asset mix, or investment horizon. Finally, compare it with previous readings using the same definitions. This helps separate a short-lived fluctuation from a persistent change without prompting a decision in response to every new reading.
For example, a broad market trend might remain positive while liquidity conditions weaken. If your portfolio includes assets that may be harder to trade, the difference deserves review. It doesn’t establish that a downturn is certain or dictate an automatic sale. Any thresholds or review rules should be chosen for the investor’s circumstances, not treated as universal standards.
False alarms, delayed signals, and missed risks
A cautious reading can persist while markets continue rising. At other times, risk can emerge faster than a slower-moving indicator reflects. Lagging measures can provide useful confirmation, but their delay can’t always be removed, and no monitoring process captures every development in real time.
Agreement across distinct measures adds context, not certainty. Treat a warning as a prompt to inspect the evidence and portfolio exposure, not as a forecast or an automatic sell instruction. That distinction keeps monitoring systematic and reduces the chance of reacting emotionally to one reading.
A Repeatable Checklist for Monitoring Portfolio Safety
A monitoring routine works best when it begins with your own portfolio, not the latest headline. Use the same sequence at each review, record observations consistently, and set a cadence that fits your investment process. This makes portfolio safety indicators easier to compare over time and less likely to prompt impulsive decisions.
A step-by-step review for long-term investors
- Document your portfolio. Record allocations across asset classes, sectors, and holdings. Note concentrated or related exposures, along with the time horizon relevant to your goals. This establishes which market changes could matter most to your portfolio.
- Review selected market conditions. Check the trend, volatility, breadth, and liquidity observations you’ve chosen to monitor. Use consistent definitions and time periods so you’re comparing like with like, rather than reacting to a change in how a measure is presented.
- Classify the evidence. Note whether signals broadly agree, conflict, or are changing at different speeds. Record what has shifted and what remains stable. A mixed reading calls for context, not a forced conclusion.
- Write down the follow-up. State what information would prompt another review and when you plan to check again. Keep this rule proportionate to your timeframe and circumstances. It’s a process for maintaining awareness, not a guarantee or a prescribed investment action.
Keep the checklist disciplined and proportionate
Choose a review interval in advance based on your own process. Avoid increasing checks simply because a headline is unsettling. In your notes, separate observations from interpretation: record which measure changed, its timeframe, and whether relevant portfolio exposures are affected. Also note what did not change. That record can help distinguish a persistent shift from a brief fluctuation at the next review.
For additional context, read this guide to identifying high-risk market periods. You can also explore systematic capital preservation and trend following market signals as related approaches to understanding risk and monitoring market conditions.
For investors who want a dedicated way to organize market-risk monitoring, the Alpha Shield Dashboard and Market Signal are designed to support systematic review. They don’t predict every decline or eliminate the possibility of losses.
Using a Market Dashboard to Organize Portfolio Safety Monitoring
A dashboard can bring selected market-health information into one review process. Its value is organization: investors can refer to a consistent set of observations instead of assembling fragments from headlines and multiple sources. It doesn’t remove the need to understand what each measure tracks or how broader conditions relate to a particular portfolio.
For long-term investors, a structured view may make monitoring more deliberate. A dashboard can support a routine of checking the same information, noting changes, and considering whether further review is warranted. It should complement an assessment of personal portfolio exposures, not replace it. For a wider discussion of market-level measures, see this macro market risk indicators guide.
What a systematic market signal can contribute
A defined market signal can provide a consistent input for observing changing market conditions. Its meaning depends on how it is constructed, what information it uses, and the timeframe it is designed to assess. Don’t assume that a particular signal reflects every risk relevant to your holdings.
Alpha Shield provides a Market Signal and a dedicated dashboard with indicators for monitoring market health and managing risk. The service is designed to help investors identify high-risk periods and manage the risk of significant drawdowns. Treat a signal as one input to a broader risk-management process, not as a certain prediction, a personal directive, or a guarantee against market declines.
When a dedicated dashboard may be useful
A dashboard may suit investors who want a more structured alternative to headline-driven monitoring. Instead of changing focus with every news alert, they can return to a defined review process and assess market observations in context. Alpha Shield’s approach emphasizes long-term capital preservation. Its founders bring more than 50 years of combined experience in investment banking and global markets, but experience doesn’t guarantee a particular outcome.
Scope matters. Alpha Shield is designed for systematic market-risk monitoring. It doesn’t provide day-trading tools, shorting strategies, or individual stock recommendations. A market signal is not an instruction to trade. Investors remain responsible for considering their own objectives, time horizon, and portfolio circumstances.
If you’re assessing whether a dedicated signal fits your monitoring process, review what it is designed to do and its limits before relying on it. The aim is a clearer routine, not certainty about what markets will do next.
Make Your Risk Review a Consistent Practice
Portfolio safety indicators are most useful when they support a steady review, not a reflexive response to market headlines. Focus on what your portfolio holds, compare different market signals in context, and record changes using consistent definitions. No indicator or dashboard can guarantee protection from losses, but a disciplined process can help make your observations clearer.
Alpha Shield’s system development began in 2017, and the service launched in 2019. Its founders bring more than 50 years of combined investment banking and global markets experience. The service combines a systematic market signal with a dedicated dashboard for monitoring market health and managing risk. It supports review, but does not provide day-trading tools, shorting strategies, or individual stock recommendations.
Choose a routine that fits your long-term approach, then follow it with patience. Consistency can help you meet changing market conditions with greater clarity and discipline.
Frequently Asked Questions
What are portfolio safety indicators?
Portfolio safety indicators are measures investors use to assess portfolio vulnerabilities and broader market conditions. They can include concentration across holdings, market trend, volatility, breadth, and liquidity. Each offers evidence about a particular risk dimension, not a complete verdict on portfolio health. For example, a diversified portfolio may still be exposed to market-wide stress, while a calm market reading won’t reveal whether a few holdings dominate an investor’s exposure.
Which indicators are useful for monitoring portfolio risk?
Useful indicators depend on what you own and the risks you need to monitor. Start with allocation across asset classes, sectors, and individual holdings. Then consider market trend, volatility, breadth, and liquidity as separate views of market conditions. A concentration check can reveal dependence on a few positions, while breadth can show whether market gains are widespread. Choose measures with clear definitions and consistent timeframes, then review them together.
Can portfolio safety indicators predict a market crash?
No. Portfolio safety indicators can help identify changing conditions or vulnerabilities, but they can’t reliably predict every market decline or its timing. A warning may appear before prices fall, persist while markets rise, or emerge only after conditions have already changed. Treat a concerning reading as a reason to review its source, timeframe, and relevance to your holdings. It isn’t a guaranteed forecast or automatic instruction to sell.
How often should I review portfolio safety indicators?
Set a review cadence that fits your investment process, portfolio, and time horizon. The right interval isn’t the same for every investor. A scheduled review can help you compare readings consistently without checking every market move or headline. You may also choose to review after a meaningful change to your holdings or objectives. Record what changed, what stayed stable, and what would prompt a follow-up check.
What should I do when market risk indicators conflict?
First, check what each measure tracks, its data source, and the period it covers. Then consider whether the reading relates to your portfolio’s actual exposures. A short-term volatility measure and a slower-moving market trend can disagree because they capture different conditions or update at different speeds. Record the mixed signals and compare them with prior readings using consistent definitions. Don’t force agreement or treat one warning as a certain forecast.
Is the VIX a reliable portfolio safety indicator?
The VIX can offer useful information about options-implied expectations for near-term S&P 500 volatility, but it isn’t a complete portfolio risk measure. It doesn’t show whether a particular portfolio is concentrated, predict market direction, or reliably forecast a crash. Interpret it alongside measures that address other risks, such as portfolio exposure and market breadth. Its meaning also depends on the timeframe and context of your review.
Can a market signal dashboard protect a portfolio from losses?
No dashboard can guarantee protection from losses or prevent every drawdown. A market signal and dashboard can help organize observations and support a more consistent risk review, but they remain inputs rather than guarantees or personalized directives. Alpha Shield provides a systematic market signal and a dedicated dashboard for monitoring market health and managing risk. It doesn’t provide day-trading tools, shorting strategies, or individual stock recommendations.


