

A market crash rarely announces itself in a way that makes the next move obvious. Headlines conflict, volatility rises, and every decision can feel urgent. Trend following market signals offer a different approach: they don’t predict what comes next. They assess current conditions using objective data.
If market swings leave you second-guessing your plan, that strain is understandable. Reacting to every headline can add uncertainty instead of reducing it. A systematic signal creates rules for recognizing elevated risk, helping investors respond with more discipline and less emotional bias.
In this guide, you’ll learn how trend-following signals work, how they can support capital preservation during drawdowns, and where their limits lie. We’ll examine the role of volatility data, including the VIX futures curve, and explain how an IN or OUT signal can turn complex market information into a clearer decision framework. The aim isn’t to eliminate risk or forecast the future. It’s to make risk easier to recognize and manage.
Key Takeaways
- Use historical market data to assess direction and filter short-term noise rather than relying on headlines for portfolio decisions.
- Understand how quantitative risk signals translate market and volatility data into clear risk-on or risk-off guidance.
- Apply predefined rules when risk rises to reduce the influence of loss aversion and make portfolio adjustments more consistently.
- Build an exposure plan before conditions deteriorate, so a defensive signal has a clear role in your wealth preservation strategy.
- Learn how trend following market signals and the Alpha Shield Dashboard can present complex market information through indicators for assessing risk.
What are Trend Following Market Signals and Why Do They Matter?
Trend following uses historical market data to identify whether prices are moving persistently upward, downward, or without a clear direction. Rather than forecast a turning point, a rules-based approach responds to evidence already visible in the market. Trend following market signals turn that evidence into a framework for assessing exposure and risk, not simply a way to pursue gains from a large move.
The underlying premise is that price movements reflect the information and expectations of market participants. But prices are noisy. Headlines, short-term reversals, and sudden shifts in sentiment can obscure the broader direction. A signal applies consistent criteria to filter that noise. Methods can include measures such as moving averages, alongside defined money-management rules. The neutral overview of the Trend following trading strategy explains some of these foundational approaches.
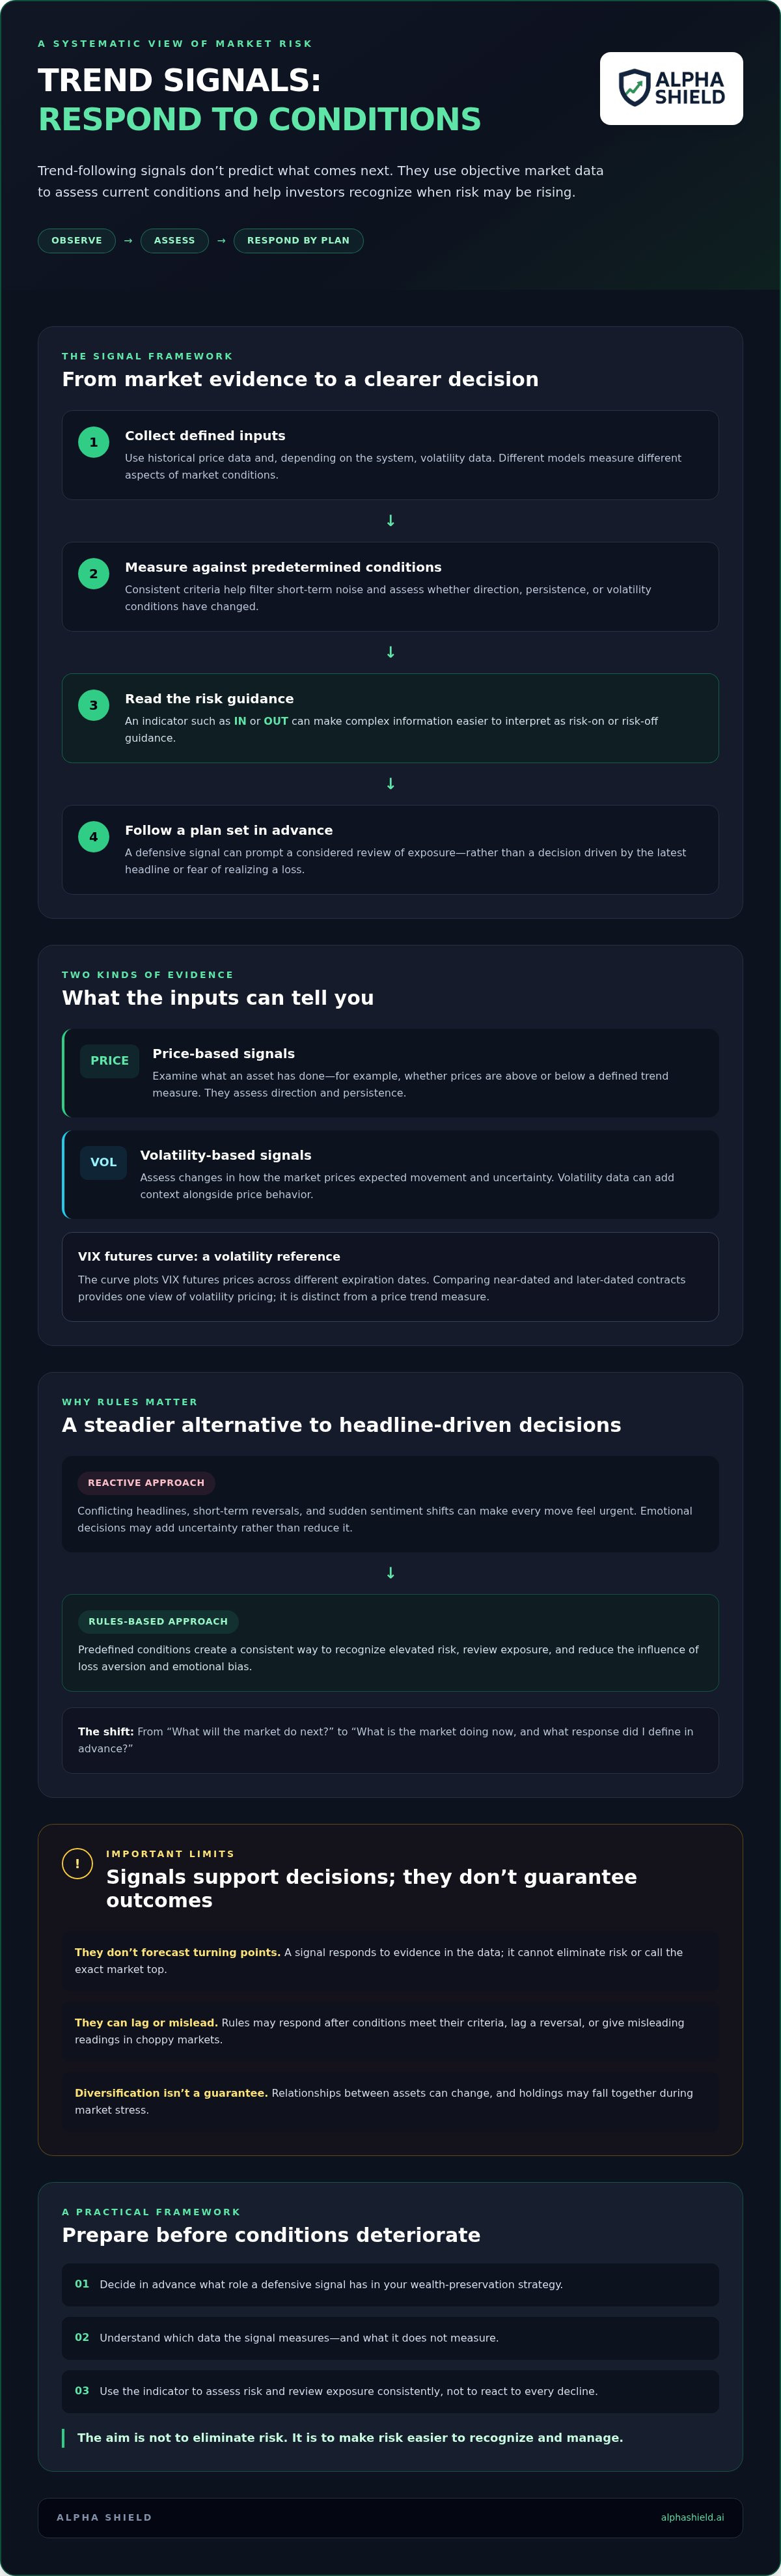
This creates a practical distinction. A discretionary investor may hold an asset because selling would make a loss feel real, or change course after a frightening headline. A systematic investor follows conditions set in advance. If the evidence indicates deteriorating market health, the framework can prompt a review of risk before emotion dictates a response. Signals aren’t guarantees: they can lag a reversal or give misleading readings in choppy markets. Their value is consistency, not certainty.
The Shift from Prediction to Participation
Prediction asks, “What will the market do next?” Trend following asks, “What is the market doing now, and what response did I define in advance?” That shift replaces confidence in a forecast with disciplined participation in observable conditions. For wealth preservation, a market-health indicator can help identify when risk is rising and when a more defensive posture deserves consideration. It doesn’t call the exact top or eliminate drawdowns.
Why Traditional Diversification Often Fails During Crashes
Diversification spreads exposure across different assets, but it can’t ensure that every holding will offset losses during market stress. Relationships between assets can change. If stocks and other holdings fall together, a portfolio that appeared balanced in calmer conditions may still experience a drawdown. That doesn’t make diversification useless. It means allocation alone may not show when the overall risk environment has shifted.
A market-health signal adds another decision layer. It can help investors assess whether existing diversification is providing the intended balance or whether risk warrants attention. The focus is not to react to every decline. It’s to use clear conditions to recognize elevated risk, then follow a considered plan. For a closer look at the process, see this guide to identifying high-risk market periods.
The Mechanics of Quantitative Risk Signals
A quantitative risk signal converts market data into a rule-based assessment. The process is straightforward: collect defined inputs, measure them against predetermined conditions, then produce an indicator such as risk-on or risk-off. The output doesn’t explain every market move. It gives investors a consistent way to assess whether conditions support maintaining exposure or warrant a more defensive review.
Quantitative systems can use different inputs. Price-based models track direction and persistence. Volatility-based models assess changes in the market’s pricing of risk. As Risk.net explains, trend-following approaches can be built using proprietary quantitative models. Rules vary by system, so investors should understand what a signal measures and what it doesn’t.
A regime change occurs when market behavior shifts, for example, from relatively stable conditions toward rising stress. No signal can identify that transition perfectly in real time. Rules respond only after the chosen data meet their criteria, which means signals may lag or change direction as conditions evolve.
Price Action vs. Volatility Signals
Price-based signals examine what an asset has done, such as whether prices have moved above or below a defined trend measure. Volatility signals ask a different question: how is the market pricing expected movement and uncertainty? One isn’t a substitute for the other. Price can remain resilient even as volatility pricing changes, so comparing distinct inputs can add context to a risk assessment.
Decoding the VIX Term Structure as a Warning Sign
The VIX futures curve plots futures prices across different expiration dates. When later-dated futures cost more than near-dated contracts, the curve is commonly described as being in contango. If near-dated futures rise above later-dated ones, it’s inverted, or in backwardation. That shift can indicate stronger demand for near-term volatility, but it isn’t a stand-alone forecast of a crash.
Alpha Shield focuses on VIX term structure as a warning input rather than relying on the emotional temperature of news headlines. Its Market Signal translates that data into an IN or OUT indication. If the measure crosses the system’s defined threshold, the signal changes. Investors can then consult a pre-established risk plan instead of reacting to each alarming story. The Alpha Shield Dashboard is designed to present complex market information through clear indicators. Learn more about the Alpha Shield Market Signal as one example of this approach.
Interpretation still matters. A risk-off reading doesn’t guarantee losses are imminent, and a risk-on reading doesn’t remove portfolio risk. The signal is a structured input for decisions, not a prediction or a promise of protection.
Objective Data vs. Market Sentiment: Why Rules Matter
Market decisions are hardest when the evidence conflicts with what an investor wants to believe. Loss aversion can make a realized loss feel more painful than an equivalent gain feels rewarding. As a result, an investor may hold a declining position, waiting to return to break-even, even when the original reasons for holding it have changed. Hope becomes a decision rule, often an unexamined one.
Rules create distance between portfolio decisions and personal attachment. A systematic process for identifying high-risk market periods starts with observable conditions, then defines what response those conditions warrant. The investor’s task is not to prove a past decision was right. It’s to assess present risk and follow a plan established before pressure builds.
The High Cost of Emotional Investing
Financial headlines compete for attention. One warns of a downturn; another argues that conditions are improving. Both may describe real events, but neither necessarily offers a consistent portfolio rule. Repeatedly changing course based on the latest story can lead to reactive decisions: staying exposed because selling feels like admitting defeat, or abandoning a plan after fear peaks. Discipline means separating new information from a predefined signal and asking whether it changes the decision criteria.
A macro market risk indicator offers a different lens. Rather than interpreting every headline, it measures specified market inputs against consistent criteria. This doesn’t make the signal infallible or remove the need for judgment. It gives judgment a stable reference point, helping investors distinguish a measurable change in risk from the emotional force of the news cycle.
Simplicity as a Luxury: Reducing Complexity to Actionable Signals
Clarity matters most when stress makes analysis harder. A useful decision process can be written down in advance:
- Define the input: Know what market data the signal evaluates.
- Set the response: Decide what action or review follows each signal state.
- Apply the rule consistently: Don’t change thresholds simply because the latest headline is persuasive.
That’s the value of anti-hype communication. It doesn’t promise certainty, predict every downturn, or claim that a single indicator can remove risk. It keeps the focus on what the evidence says and what the plan calls for. Trend following market signals can reduce decision noise by turning a complex market environment into a defined input for risk management. The objective is not to feel confident about every move. It’s to avoid letting ego, fear, or a compelling headline quietly rewrite the rules.
Integrating Trend Signals into a Wealth Preservation Strategy
A market signal is useful only when it connects to a decision process. Before conditions become stressful, decide what each signal state means for your portfolio. The aim isn’t to react to every fluctuation. It’s to have a repeatable framework for reviewing exposure when evidence of elevated risk appears.
A practical process can follow four steps:
- Set your baseline. Record your current allocation and the level of portfolio volatility or decline you can realistically tolerate.
- Define your response in advance. Decide what you’ll review if the signal changes, such as whether your current exposure still fits your plan.
- Follow the signal consistently. If it moves to a defensive or red state, make capital preservation the priority and apply your predefined review rather than reacting to headlines.
- Reassess when conditions change. When the signal changes again, review your plan before adjusting exposure. Don’t treat one reading as a guarantee or a command to make an immediate trade.
This approach to systematic capital preservation is distinct from strategies based on frequent trading or positions designed to profit from falling prices. Its purpose is to help investors recognize changing risk and consider their exposure through a consistent, long-term lens.
Calibrating Your Risk Tolerance to Market Reality
Risk tolerance isn’t just a number chosen in calm conditions. It also reflects whether you can stay committed to your plan during a sustained decline. If a defensive signal would prompt you to review exposure, define that response before volatility rises. Then check that your plan accounts for time horizon, liquidity needs, and the possibility that signals can lag or reverse.
The Role of a Market Timing Signal Dashboard
A dashboard can reduce the work of interpreting multiple inputs by presenting a signal in a consistent format. The Alpha Shield Dashboard is designed to simplify complex market information into clear indicators. Investors can use that view as a reference point for their own predefined process, not as a substitute for understanding portfolio needs or making considered decisions.
Drawdown management matters because losses reduce the capital available to participate in a recovery. The deeper the decline, the greater the gain required to return to the starting value. Limiting exposure to severe losses can therefore support the conditions needed for long-term compounding, although no signal can eliminate drawdowns or ensure a particular outcome. Trend following market signals are best understood as a tool for managing risk, not a promise to avoid every market decline.
Alpha Shield: Systematic Signals for Long-Term Protection
Alpha Shield is built around a specific role: helping investors assess market risk so they can make more disciplined decisions about portfolio exposure. The Alpha Shield Market Signal uses the VIX futures curve, or term structure, as a data-based warning input. It turns complex market conditions into a clear indicator, rather than asking investors to interpret every headline on their own.
System development began in 2017. Alpha Shield was founded by former investment bankers and global markets professionals with more than 50 years of combined experience. That background informs a focus on risk management and long-term capital preservation. The goal isn’t to predict the exact timing of a market turn or promise that losses can be avoided. It’s to provide a consistent framework for recognizing risk and considering a defensive response.
A Rational Anchor in Market Chaos
When financial news is urgent and contradictory, a defined signal can serve as a steady reference point. The Alpha Shield Dashboard presents market information through clear indicators, helping users focus on the signal’s reading rather than the volume of commentary around it. That simplicity can reduce the mental burden of decision-making, but it doesn’t replace an investor’s plan or judgment. A signal is one input, and its limitations matter: market conditions can change, and no indicator guarantees a particular outcome.
Protecting Your Portfolio with a Long-Term Framework
Alpha Shield is not a stock-picking service. The Market Signal and Dashboard are designed to help investors evaluate broad market risk, not identify individual securities. They support a longer-term wealth-preservation process, where a risk indicator can inform a review of exposure without requiring constant portfolio decisions.
That distinction is central to the role of trend following market signals in risk management. The focus is not on chasing every market move. It is on using objective information to decide when caution may deserve greater weight. Investors should understand what a signal measures, how it fits their own circumstances, and what action they will consider if conditions change. Alpha Shield provides a systematic tool for interpreting volatility, not a substitute for a complete investment plan or a guarantee against drawdowns.
Make Risk Management a More Deliberate Part of Your Plan
Trend following market signals offer a structured way to assess changing conditions without relying on forecasts or reacting to every headline. Their value lies in consistency: objective data informs a planned response, while drawdown management keeps long-term capital preservation in focus.
Alpha Shield offers investors a systematic, data-driven signal focused on market crash protection and managing drawdown risk. Founded by former investment bankers and global markets professionals with more than 50 years of combined experience, it aims to provide a rational reference point in volatile markets. No signal can eliminate risk or guarantee an outcome, so consider how any indicator fits your goals, time horizon, and overall investment plan.
A clear process can make difficult market periods easier to approach. With disciplined rules and a focus on what you can control, you can make investment decisions with greater clarity.
Frequently Asked Questions
What is a trend following market signal?
A trend following market signal is a rule-based reading of market data that helps identify current direction or risk conditions. It responds to observed information rather than trying to predict an exact market top or bottom. Signals may use price trends, volatility measures, or other defined inputs. Their purpose is to support consistent decisions, not guarantee returns or remove the need to consider your goals and risk tolerance.
How do trend following signals help avoid market crashes?
Trend following signals can help investors recognize rising risk and consider a more defensive portfolio posture before losses deepen. They do this by applying consistent rules to market data, rather than relying on headlines or instinct alone. No signal can predict every crash or prevent all losses, and some may respond after conditions have already changed. Treat a signal as an input to a predefined risk-management plan, not a guarantee.
Is trend following the same as day-trading?
No. Trend following describes a method for responding to market direction, while day-trading refers to buying and selling within a single trading day. A trend-following approach can inform longer-term risk decisions and doesn’t inherently require frequent trades. Alpha Shield focuses on systematic market signals for long-term capital preservation. The time horizon and actions depend on the specific strategy, its rules, and how an investor chooses to apply its information.
Can trend following signals be used for 401k or retirement accounts?
Potentially, but whether a signal can guide decisions in a 401(k) or other retirement account depends on the account’s available investment options, plan rules, and your circumstances. A signal may help frame a review of market risk, but it doesn’t determine which choices your plan permits or what’s suitable for you. Check your plan documents and consider consulting a qualified financial professional before making allocation changes.
How does the VIX term structure relate to market signals?
The VIX term structure shows VIX futures prices across different expiration dates. Its shape reflects how the market prices expected volatility over near and later time horizons. A change in the curve can provide information about shifting risk conditions, but it isn’t a direct prediction of a crash. Alpha Shield uses VIX term structure as a data input for its market signal, providing a systematic alternative to reacting to headlines alone.
What happens to the signal during a sideways or choppy market?
In a sideways or choppy market, trends can weaken and reverse before they become sustained. A trend-following system may then produce misleading changes or struggle to identify a durable direction, a risk often described as whipsaw. The exact response depends on the system’s inputs and rules. Investors should understand that signals can change as market conditions evolve and follow a consistent plan rather than reacting impulsively to each shift.
Do I need technical expertise to use a market signal dashboard?
You don’t necessarily need advanced technical expertise to understand a dashboard’s indicators, but you should know what the signal measures and what its limits are. The Alpha Shield Dashboard is designed to present market information through clear indicators. Before relying on any dashboard, review how its readings fit your decision process. A clear display can reduce complexity, but it can’t replace a suitable investment plan or guarantee a particular outcome.
Why is capital preservation more important than catching every market peak?
Capital preservation focuses on managing the risk of deep losses, rather than trying to identify every market peak or capture every gain. A larger portfolio decline requires a larger percentage recovery to return to its starting value, which can make drawdown management important to long-term compounding. Preservation doesn’t mean avoiding all risk or remaining defensive at all times. It means applying a disciplined process to protect capital when conditions warrant greater caution.


