

Catastrophic market crashes don't strike out of nowhere; they leave distinct structural footprints across volatility mechanics long before asset prices collapse. You already know the exhausting cycle of reacting to breathless financial media headlines. When systemic crises hit, traditional buy-and-hold diversification routinely fails because asset correlations snap toward 1.0 across the board. Meanwhile, conventional retail indicators generate relentless false positives, bleeding your capital through unnecessary portfolio churn. Successfully identifying high risk market periods requires stripping away speculative noise and tracking cold, mechanical data instead.
This guide shows you how to objectively detect market fragility using systematic macro indicators and volatility metrics before catastrophic drawdowns strike. You'll gain a repeatable, rules-based framework designed to differentiate routine market pullbacks from true structural breakdowns, protecting multi-year compounding without the guesswork. Here's how to replace emotional anxiety with transparent, systematic portfolio defense.
Key Takeaways
- Understand the brutal mathematics of drawdowns and why avoiding a 50% loss protects decades of capital compounding.
- Discover how shifting focus to the VIX futures curve provides an objective edge for identifying high risk market periods before prices plunge.
- Learn a rules-based, multi-tiered framework to separate standard market volatility from acute systemic breakdowns.
- Examine historical data debunking conventional Wall Street dogma about staying fully invested through severe market shocks.
- See how institutional-grade engines synthesize complex macro and volatility metrics into simple, actionable defense signals.
Understanding Market Fragility: Why Identifying High Risk Market Periods Dictates Long-Term Compounding
Most retail market commentary treats volatility as an opportunity for leveraged day-trading or rapid shorting. Institutional risk management operates on the opposite principle: capital preservation. A high-risk market period is not defined by arbitrary backward-looking labels, such as a drop crossing a 10% or 20% threshold. Instead, it is a structural regime where systemic fragility spikes, causing downside asymmetry to overwhelm upside expectation. When these structural conditions emerge, standard market mechanics break down. The core objective of financial risk management is anticipating these fragile regimes before catastrophic capital destruction occurs.
Passive buy-and-hold strategies rely on the assumption that markets inevitably recover quickly. History shows that severe cycle crashes stall compounding for years, sometimes decades. When broad equity indices drop 50% or more, capital doesn't simply bounce back. It enters a prolonged recovery period where investors spend years merely regaining lost ground rather than compounding wealth. Mastering the process of identifying high risk market periods is the difference between consistent multi-decade growth and enduring multi-year portfolio stagnation.
The Mathematical Asymmetry of Severe Drawdowns
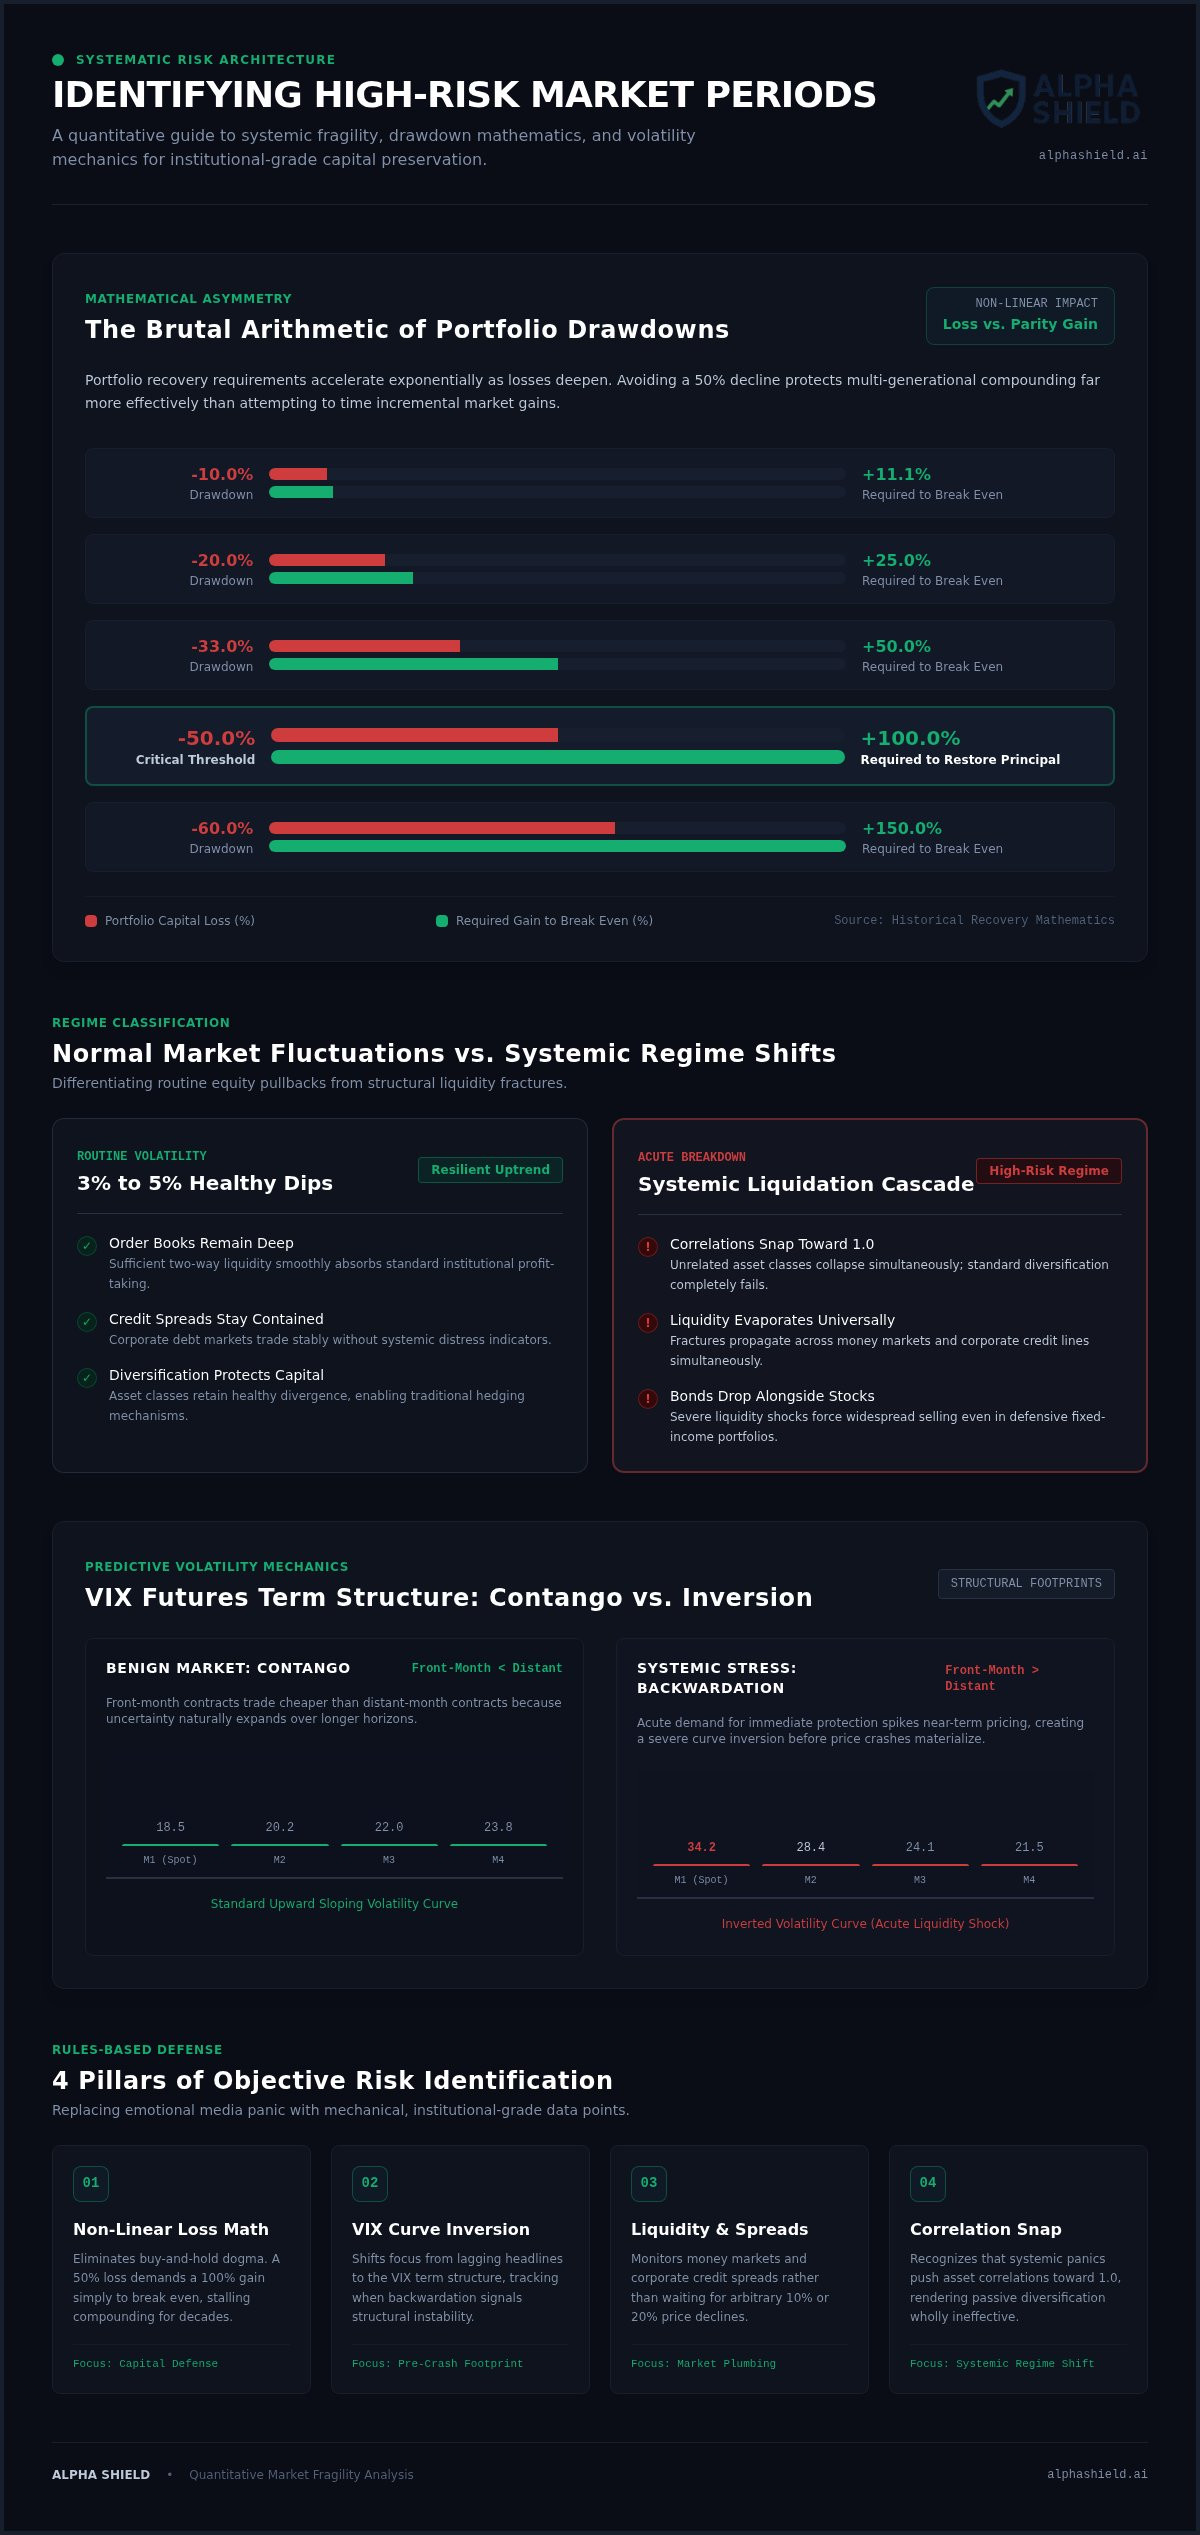
The arithmetic of capital loss is brutally non-linear. As losses deepen, the required recovery gain accelerates exponentially:
- A 10% loss requires an 11.1% gain to break even.
- A 20% loss requires a 25% gain to restore principal.
- A 33% loss requires a 50% gain to reach parity.
- A 50% loss requires a 100% gain simply to break even.
- A 60% loss requires a 150% gain to recover.
Stepping aside to avoid a 50% decline protects multi-generational capital far more effectively than trying to time every fractional market peak. Deep portfolio drawdowns also carry a severe psychological cost. When paper losses cross emotional tolerance levels, investors frequently capitulate near the ultimate market trough, locking in devastating capital destruction permanently.
Normal Market Fluctuations vs. Systemic Regime Shifts
Discipline requires distinguishing between standard market pullbacks and systemic regime transitions. Routine 3% to 5% dips reflect healthy profit-taking within a resilient uptrend. Order books remain deep, credit spreads stay contained, and market liquidity absorbs selling pressure smoothly. Systematic liquidation cascades look entirely different.
During a systemic regime shift, liquidity evaporates across money markets and corporate credit. Correlations across unrelated asset classes converge toward 1.0. Investors expecting traditional fixed-income positions to hedge equity exposures often discover that during severe liquidity shocks, bonds can drop alongside stocks. Identifying high risk market periods means tracking these structural liquidity fractures rather than guessing the daily news cycle.
The 4 Core Quantitative Indicators for Identifying High Risk Market Periods
Lagging media narratives focus on economic headlines after damage is done. Institutional desks monitor structural mechanics instead. The fundamental framework of Measuring and Managing Market Risk requires tracking shifts in positioning, price dispersion, and market stress before index levels break down. Identifying high risk market periods demands four specific quantitative pillars that decode capital flows in real time.
These mechanics reveal how capital moves beneath the surface of headline numbers. Rather than reacting to quarterly economic reports, disciplined investors monitor a transparent set of macro market risk indicators to detect vulnerability early.
Volatility Term Structure and VIX Inversion Mechanics
Under benign market conditions, the VIX futures curve trades in contango. Front-month contracts price cheaper than distant-month contracts because uncertainty expands naturally over longer time horizons. Systemic stress breaks this relationship, forcing the curve into backwardation.
"When near-term volatility futures trade at an aggressive premium over deferred contracts, institutional market participants are actively paying up for immediate structural protection. Curve inversion isn't speculative noise; it is capital running for cover."
If spot VIX rises while the curve remains in contango, the dip is generally manageable. If the curve inverts sharply into backwardation, systemic liquidity is under pressure. For investors looking to track these volatility dynamics systematically without building custom quant feeds, the Alpha Shield Dashboard provides real-time visibility into these regime changes.
Market Breadth and Internal Divergences
Headline equity benchmarks frequently conceal internal distribution. Market breadth metrics, such as the Advance-Decline Line and the percentage of equities trading above their 50-day and 200-day moving averages, expose whether a rally has structural support.
A dangerous divergence occurs when capitalization-weighted indices establish fresh highs while the Advance-Decline line slopes downward. A handful of mega-cap constituents are holding the benchmark aloft while hundreds of individual equities decline quietly. When the remaining leaders stumble, the entire structure gives way.
High-Yield Credit Spreads and Liquidity Contraction
Debt markets consistently price risk ahead of equity desks. High-yield credit spreads reflect the incremental yield demanded by lenders to absorb corporate default risk relative to benchmark treasuries. The transition into a dangerous regime typically unfolds in three sequential phases:
- Phase 1: Spread Widening. High-yield spreads blow out while equity indices remain near all-time highs, signaling stress in lower-tier corporate balance sheets.
- Phase 2: Money Market Tightening. Interbank borrowing rates and short-term paper markets demand higher liquidity premiums, indicating conservative balance-sheet allocation across major dealer desks.
- Phase 3: Liquidity Evaporation. Liquidity drying up across secondary credit markets triggers forced selling in liquid public equities to meet redemption requirements.
Tracking these debt dynamics provides an unvarnished view of financial conditions. Identifying high risk market periods becomes straightforward when credit spreads widen and market liquidity contracts simultaneously.
How to Measure and Respond to Escalating Market Risk
Most retail traders rely on tight stop-losses, producing costly whipsaws and portfolio churn. Annual rebalancing approaches offer zero protection during a sudden, multi-month liquidation cascade. Academic research on the Limitations of Traditional Risk Models confirms that conventional static approaches consistently fail to anticipate rapid volatility clustering and structural market breakdowns. Successfully identifying high risk market periods requires an operational, rules-based defense framework that turns quantitative signals into immediate allocation changes.
Instead of digesting daily market commentary, institutional capital runs a methodical protocol. First, audit objective macro metrics weekly to eliminate media noise. Second, classify current market conditions using explicit quantitative thresholds. Third, adjust cash reserves systematically as conditions degrade. Finally, enforce these defensive positions until the data confirms a stable regime has returned.
Establishing an Objective Risk Rating Matrix
A functional risk engine categorizes market environments into three transparent states. Each state dictates exact portfolio exposure:
- Green (Expansion Regime): VIX futures sit in standard contango; market breadth shows broad participation; credit spreads remain compressed. Equity exposure remains at 100%.
- Yellow (Fragile Regime): Breadth divergences emerge; credit spreads widen moderately; volatility surfaces flatten. Equity exposure trims to 60-70%, redirecting proceeds into cash equivalents.
- Red (High-Risk Regime): VIX term structure inverts into backwardation; interbank funding conditions tighten; breadth fractures completely. Capital shifts into maximum defense mode, holding 80-100% in cash or short-dated sovereign debt.
These thresholds must be non-discretionary. If the rules trigger a Red classification, you de-risk automatically. Subjective second-guessing destroys systematic protection.
Systematic Capital Defense Execution Without Emotional Panic
Capital preservation does not mean shorting equities, buying leveraged inverse products, or trading complex derivatives. Speculative downside bets expose capital to severe borrowing costs, volatility decay, and sharp counter-trend rallies. Institutional risk mitigation prioritizes simplicity: moving capital into short-term Treasury bills or ultra-short government instruments.
Cash preserves absolute nominal liquidity while systemic dislocations resolve. This disciplined stance strips panic out of portfolio management. You don't dump positions because prices fall; you rotate capital because objective indicators confirm a fragile regime. For an in-depth breakdown of institutional execution rules, read our complete guide on market crash defense strategies. Mastering the discipline of identifying high risk market periods gives you the clarity to step aside calmly while others face catastrophic drawdowns.
The Critical Flaws of Conventional Risk Timing and How Systematic Models Solve Them
Mainstream financial media routinely repeats a familiar industry talking point: stepping aside during market declines destroys your long-term returns. This conventional warning assumes that risk management is synonymous with impulsive, emotional market timing. Discretionary timing fails because it relies on gut instinct, fear, and headline predictions. Systematic risk mitigation operates on mathematical thresholds, not speculative forecasts. By objectively identifying high risk market periods, investors avoid severe capital destruction without engaging in the erratic trading behavior Wall Street cautions against.
The core objective is straightforward: protect the compounding base. When you insulate a portfolio from structural market dislocations, you eliminate the catastrophic drawdowns that derail multi-decade wealth accumulation. Systematic models don't guess bottoms or tops; they measure ongoing structural stability and adjust exposure according to strict rules.
The 'Missing the Best Days' Fallacy Examined
The standard industry study warns that missing the ten best market days devastates your final portfolio balance. What these studies omit is a critical structural truth: the market's strongest single-day advances occur almost exclusively within severe, high-volatility bear market regimes.
Massive counter-trend rallies are bear market traps. They emerge during periods of acute dislocation when market-wide circuit breakers trip and forced liquidations spark violent short squeezes. Missing these explosive single-day rebounds is an acceptable tradeoff when you successfully sidestep the crushing down days that surround them. Avoiding catastrophic losses mathematically outcompounds chasing violent, short-lived relief rallies during systemic breakdowns.
Removing Subjective Human Bias from Capital Allocation
Discretionary management is fundamentally vulnerable to cognitive distortions. When markets enter fragile conditions, psychological biases hijack rational decision-making:
- Anchoring: Fixating on portfolio high-water marks, preventing investors from reducing risk because asset prices currently sit below recent peaks.
- Loss Aversion: The emotional pain of taking a modest defensive loss prevents action, leading investors to hold depreciating assets through severe multi-year downturns.
- Late-Stage Euphoria: Fear of missing out compels capital allocators to maintain full equity exposure long after breadth and credit conditions have fractured.
Discretionary decision-making paralyzes investors precisely when decisive action matters most. A quantitative model strips emotional noise entirely out of the equation. By transforming complex volatility metrics into binary, rule-based execution parameters, systematic models replace human anxiety with disciplined operational clarity. Objectively identifying high risk market periods removes the destructive emotional impulse to hold assets all the way down to a cyclical floor.
Implementing Institutional-Grade Protection: The Alpha Shield Approach
Institutional investment desks do not safeguard multi-million-dollar portfolios using retail charting software, day-trading indicators, or static target-date funds. They rely on quantitative risk engines engineered strictly for capital preservation. Private investors seeking to protect wealth face a stark reality: static diversification guarantees full downside participation when systemic liquidations strike. Successfully identifying high risk market periods requires institutional-grade data synthesis that filters market noise into clear, actionable defense instructions.
Alpha Shield was founded by former investment bankers and global markets professionals with over 50 years of combined experience. System development began in 2017, leading to active platform deployment in 2019. The platform serves as an objective filter, transforming complex macro and volatility telemetry into a systematic defense mechanism. Learn how disciplined investors maintain safety through the Alpha Shield systematic market signal.
From Complex Quantitative Models to Decisive Clarity
Simplicity is the ultimate luxury in risk management. Processing gigabytes of daily market data across term structure curves, credit spreads, and money market liquidity creates cognitive overload. The Alpha Shield engine continuously monitors these complex variables behind the scenes, decoding systemic health and resolving it into a transparent market crash and drawdown tool.
The system evaluates volatility regimes, debt stress, and liquidity metrics every day. Instead of producing ambiguous probabilities, the Alpha Shield Market Signal synthesizes these inputs into a single, definitive directive. If the market shifts into an unstable regime, the signal dictates defense immediately. When conditions normalize, it signals re-entry. Investors follow clear rules without spending hours analyzing raw data feeds.
The Long-Term Path to Disciplined Wealth Preservation
Professional risk management is defined as much by what it avoids as what it executes. Alpha Shield rejects speculative excess entirely:
- No day-trading: Eliminates continuous screen monitoring, noise, and intraday churn.
- No shorting strategies: Avoids unlimited upside liability, borrow fees, and sudden short squeezes.
- No individual stock picking: Bypasses single-company idiosyncratic risk, earnings gaps, and accounting fraud.
Instead of enduring emotional whiplash, investors monitor market health through the Alpha Shield Dashboard. The interface provides quiet, sober transparency into current risk regimes. You don't have to guess whether the latest geopolitical conflict or interest rate change threatens your portfolio. The dashboard displays systemic posture with objective clarity. By identifying high risk market periods through disciplined mathematical triggers, you take control of exposure before severe drawdowns destroy decades of wealth compounding.
Take Control of Your Capital Before the Next Structural Breakdown
Preserving multi-decade wealth does not require predicting the future. It requires respecting the brutal mathematics of drawdowns and identifying high risk market periods before systemic dislocations destroy your portfolio. Passive buy-and-hold strategies expose you to multi-year recovery stalls, while emotional trading produces costly false positives. True long-term compounding is achieved by tracking volatility term structure, monitoring credit spreads, and stepping aside systematically when market fragility spikes.
Alpha Shield was built by global market veterans with over 50 years of combined institutional experience to solve this challenge. The system delivers data-driven systemic crash protection without day-trading, shorting, or speculative stock picks. By distilling complex market mechanics into a single, definitive market signal, it provides the disciplined structure long-term wealth demands.
You don't have to navigate volatile markets with anxiety or guesswork. Embrace systematic clarity, protect your capital base, and compound your wealth with absolute confidence.
Frequently Asked Questions
Can regular investors accurately identify high risk market periods before a major crash begins?
Yes, regular investors can spot these environments by monitoring objective market structure rather than subjective commentary. Major drawdowns leave clear signatures across credit spreads, market breadth, and volatility curves before index levels plunge. Utilizing an institutional-grade framework removes personal emotion and guesswork. This systematic approach allows individual capital allocators to detect deteriorating liquidity and step aside long before catastrophic liquidation events unfold.
What is the difference between a normal market correction and a high risk market period?
A normal correction is a temporary 5% to 10% decline where market mechanics remain completely healthy. Credit spreads stay tight, volatility curves maintain upward-sloping contango, and selling reflects routine profit-taking. A high-risk period represents a structural breakdown. Liquidity evaporates across interbank debt, cross-asset correlations spike toward parity, and volatility term structure inverts. When these structural signals flash, the risk of a severe cascading crash accelerates dramatically.
Why is the VIX futures curve more reliable than financial news headlines for identifying market danger?
Financial media headlines react to past price movements and maximize sensationalism to drive viewer engagement. The VIX futures curve reflects real institutional money pricing risk across specific future dates. When the front month trades at a premium to deferred contracts, large institutions are paying high premiums for urgent portfolio insurance. This mechanical inversion serves as a direct, unvarnished indicator for identifying high risk market periods without media noise.
Does systematic capital preservation require shorting the stock market or buying complex put options?
Capital preservation does not require shorting stocks or trading complex options. Short strategies introduce unlimited upside liability, expensive borrowing costs, and severe risk from violent counter-trend rallies. Systematic downside defense focuses on capital preservation through simplicity. Moving capital into short-term Treasury bills or cash equivalents eliminates downside exposure, protects nominal principal, and keeps your compounding base intact while market dislocations run their course.
What should an investor do with their capital once a high risk market period is identified?
Capital should systematically transition into ultra-short government debt, Treasury bills, or secure cash equivalents. The objective is maintaining nominal liquidity while asset correlations converge during a crash. Investors don't need to pick defensive stocks or attempt intraday market timing. Once the quantitative engine confirms market stability has returned, capital re-enters broad equity allocations calmly, having completely avoided the compounding destruction of a severe cycle downturn.
How do high-risk market periods affect standard 60/40 balanced retirement portfolios?
Standard 60/40 balanced portfolios often experience severe drawdown pressure during systemic crises. The underlying thesis assumes bonds will consistently rise when equities fall. During severe liquidity shocks or inflationary tightening regimes, equities and fixed-income assets frequently drop at the same time. This correlation breakdown exposes retirees to devastating multi-year losses, proving that passive asset-class diversification cannot replace dynamic, rules-based risk mitigation.
How frequently should an investor assess market health to avoid portfolio-destroying drawdowns?
A weekly operational review is ideal for long-term capital preservation. Checking positions every hour triggers emotional over-trading, noise reaction, and behavioral mistakes. Conversely, rebalancing once a year leaves your portfolio completely undefended against rapid, multi-month crashes. Reviewing systematic risk metrics weekly provides the optimal cadence for identifying high risk market periods early while keeping execution calm, deliberate, and entirely free of daily anxiety.


