

A market crash rarely announces itself with one unmistakable warning. The practical question is whether several market crash early warning indicators point to the same underlying risk, or whether ordinary volatility is creating noise.
Valuations, credit conditions, volatility, interest rates, and market breadth each reveal a different part of the picture. No single measure can reliably identify when a crash will begin. Some signals arrive late, and others produce false alarms.
This article explains which indicator groups are worth monitoring, what each can tell you, and how to interpret them without treating any reading as a forecast. You’ll learn how to distinguish broader deterioration from routine market swings, compare signals that update at different speeds, and use a repeatable review process. The goal isn’t to predict an exact crash date. It’s to assess changing conditions more consistently and make measured decisions.
Key Takeaways
- Learn what market crash early warning indicators measure, and why a risk signal is not a forecast of a crash date.
- Distinguish volatility, credit, and trend measures by the type of market risk they can reveal.
- Compare leading, coincident, and lagging indicators to understand what each may show and when.
- Use a four-step review process to assess signals consistently instead of reacting to every headline.
- See how the Alpha Shield Market Signal and dashboard provide systematic context for monitoring market health and drawdown risk.
What market crash early warning indicators measure, and what they do not
Market crash early warning indicators are measures that may reveal deteriorating conditions in a particular part of the market. They can track changes in volatility, credit risk, price trends, or other market mechanics. Because they measure different things, no single indicator can establish on its own that a crash is coming.
An early warning indicator is evidence about risk, not a date-specific forecast. A reading can show that conditions have become more fragile or that investors are pricing in greater uncertainty. It cannot tell you with certainty whether a sharp decline will follow, how large it might be, or when it could begin. Signals may lag when they rely on data about past activity. They may conflict because different market segments adjust at different speeds. And they may trigger a false alarm if conditions stabilize before a broader decline develops.
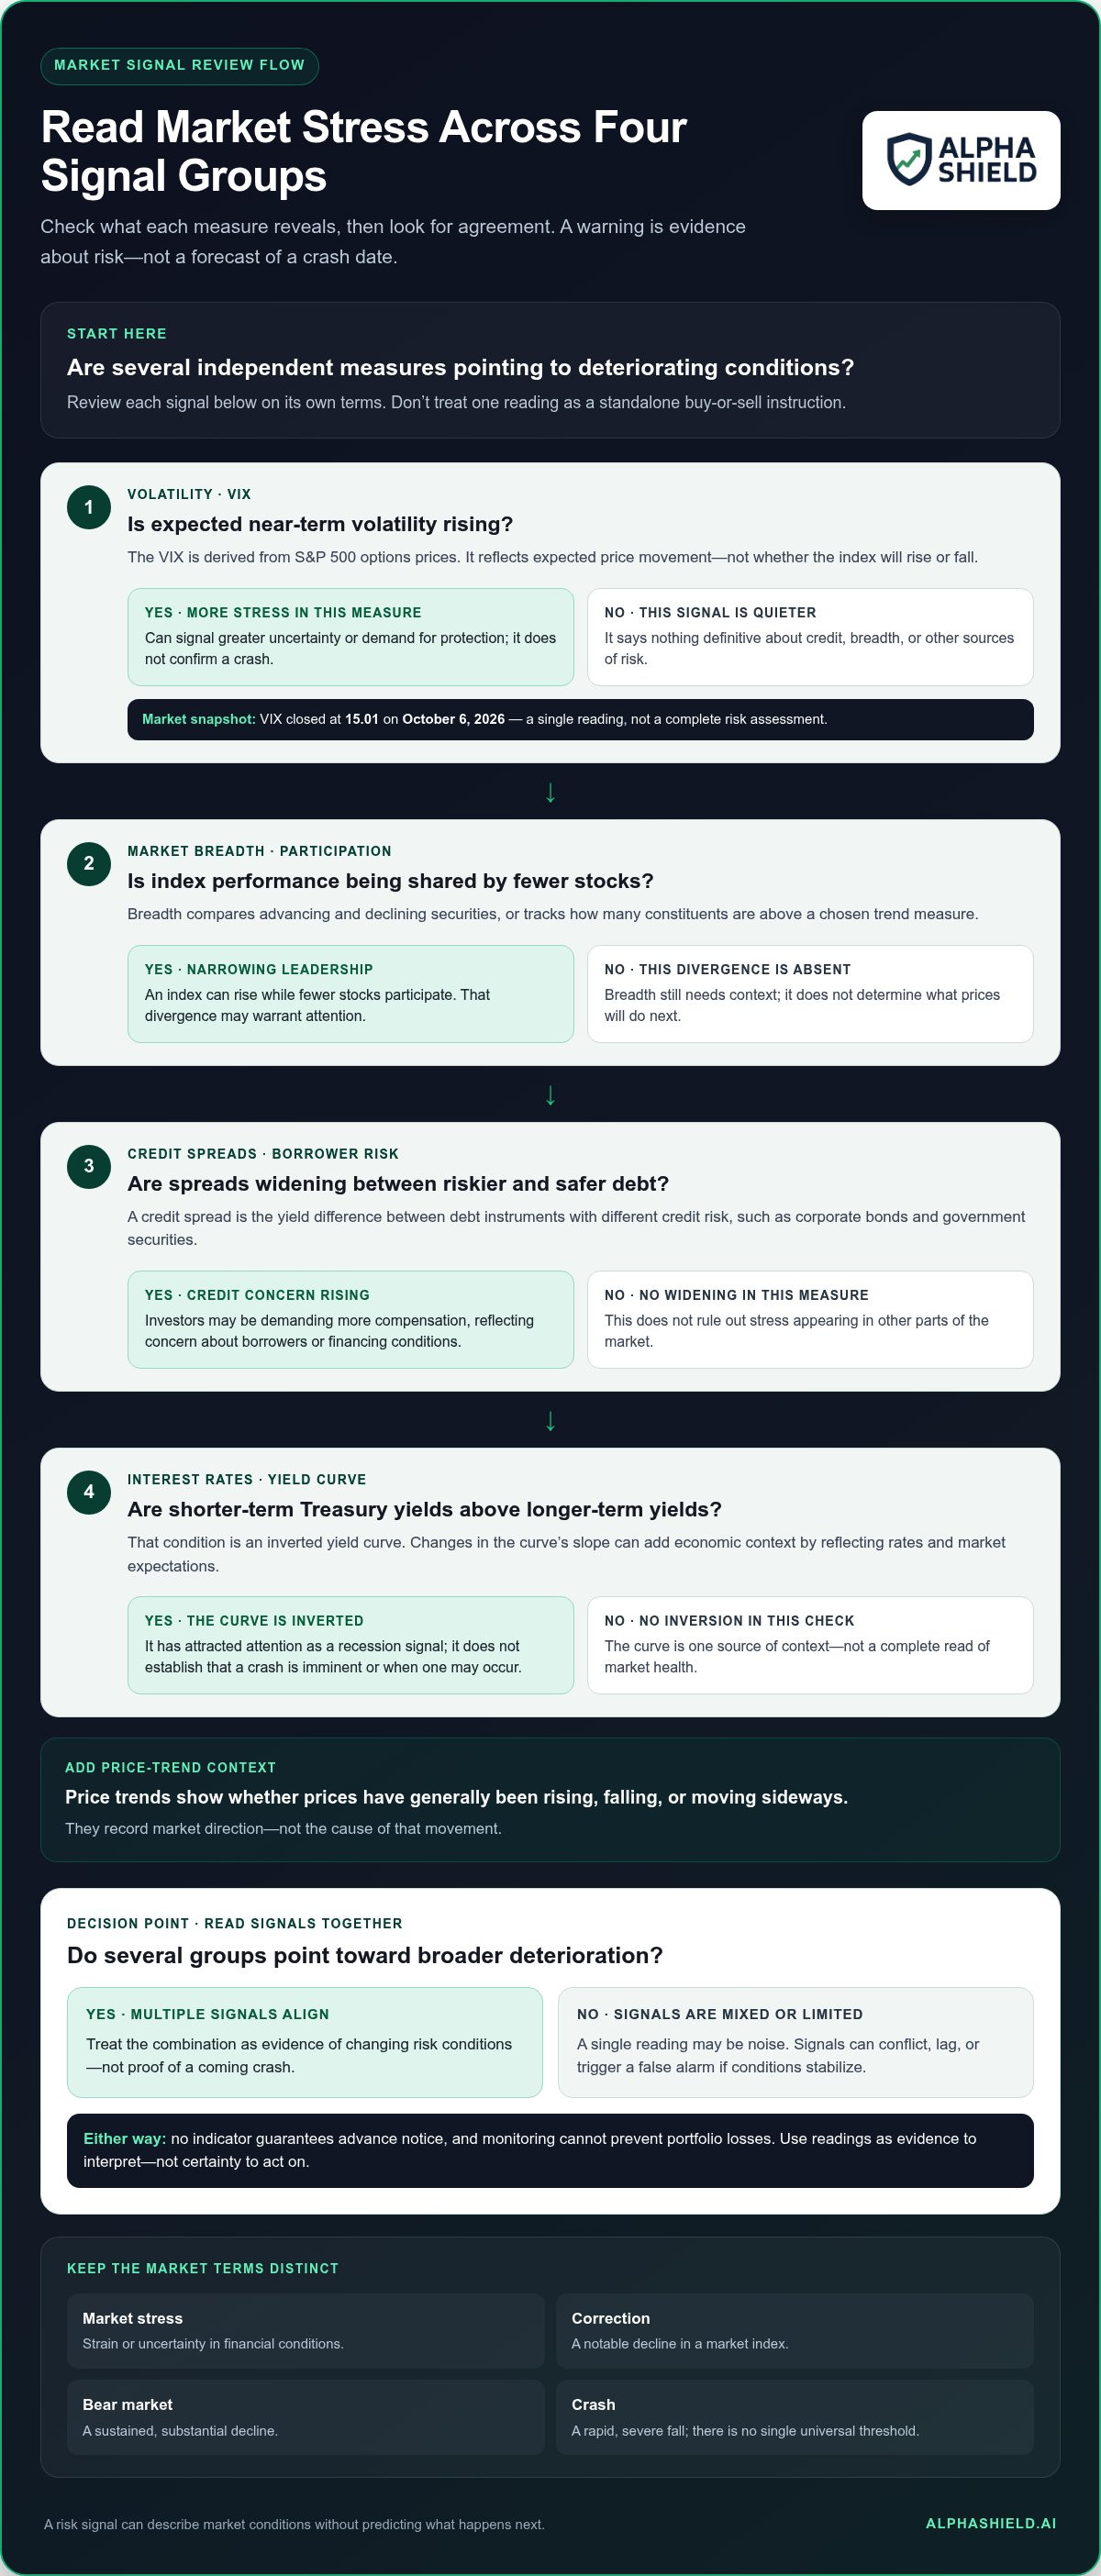
Keep the terms distinct. Market stress describes strain or uncertainty in financial conditions. A correction is a notable decline in a market index, while a bear market describes a sustained, substantial decline. A crash is a rapid, severe market fall, though the term has no single universal threshold. The Stock market crash overview discusses how crashes can arise from interacting forces such as speculation and changing investor behavior. A warning sign may reflect stress without confirming that a correction, bear market, or crash will occur.
What counts as a market crash warning sign?
A warning sign is a measure of a defined condition, not a verdict on the whole market. Rising volatility, for example, can indicate greater expected price movement. Widening credit spreads can reflect increased concern about borrowers’ ability to repay. Each reading adds context, but a single value without its history or related signals is not a standalone buy-or-sell instruction.
For a simple price example, an S&P 500 drawdown measures how far the index has fallen from a previous peak. If it drops from 5,000 to 4,750, the drawdown is 5%. That describes the index’s movement over that period. It does not, by itself, explain why prices fell or whether the decline will deepen.
Why early warnings are not exact predictions
Markets reprice as expectations change and new information arrives. A warning may emerge when investors become more cautious, then fade if economic or financial conditions improve. Someone treating the signal as a crash forecast might call that a false positive, even though it registered a temporary rise in risk.
No indicator guarantees advance notice, and monitoring signals cannot prevent portfolio losses. Their value is narrower: they can help investors assess changing conditions and ask better questions. Treat each reading as evidence to interpret, not certainty to act on.
How volatility, credit, and trend indicators reveal different kinds of risk
Market crash early warning indicators are most useful when grouped by what they measure. Volatility reflects expected price movement. Market breadth shows how widely gains or losses are shared. Credit spreads track perceived borrower risk, while interest rates and price trends add economic and market-direction context. These measures are related, but they are not interchangeable.
Volatility and market breadth: measuring stress and participation
The VIX is derived from S&P 500 options prices and reflects the market’s expectation of near-term volatility. It estimates the scale of anticipated price movement, not whether the index will rise or fall. A higher reading can signal greater uncertainty or demand for protection, but it does not confirm that a crash is approaching. For context, the VIX closed at 15.01 on October 6, 2026, according to the supplied market data. That single close is a snapshot, not a complete risk assessment.
Breadth looks beneath an index’s headline performance. It measures participation by comparing advancing and declining securities, or by tracking how many constituents are above a chosen trend measure. If an index rises while fewer of its stocks participate, leadership may be narrowing. That divergence can warrant attention, but it needs context: an index can remain strong with concentrated leadership, and weak breadth does not determine what prices will do next.
Credit, rates, and trend: checking whether weakness is broadening
A credit spread is the difference in yield between debt instruments with different credit risk, such as corporate bonds and government securities. If spreads widen, investors may be demanding more compensation to hold riskier debt. That can indicate growing concern about credit quality or financing conditions, but it is not a countdown to a market decline. The Federal Reserve Bank of Chicago’s discussion of Detecting Early Signs of Financial Instability illustrates how researchers examine financial-condition measures as potential warning evidence.
The Treasury yield curve compares yields across government debt maturities. Changes in its slope can provide economic context because they reflect interest rates and market expectations. An inversion, when shorter-term yields exceed longer-term yields, has attracted attention as a recession signal, but it does not establish that a crash is imminent or specify its timing. Price trends add a separate view: they show whether prices have generally been rising, falling, or moving sideways, not the cause of that movement.
These signal types add context because they observe different mechanisms. Volatility captures options-market expectations, breadth measures participation, credit spreads reflect perceived borrower risk, yield-curve changes reflect rate and economic expectations, and price trends record market direction. If several deteriorate together and persist, concern may be more substantial than after a one-day move in one measure. Confirmation strengthens an assessment, not its certainty.
For investors who want a consistent way to review market health and drawdown risk, the Alpha Shield Market Signal and dashboard provide a systematic monitoring framework. The purpose is context, not an exact crash forecast.
Can early warning indicators really predict a market crash?
No. Market crash early warning indicators can help assess whether risk is changing, but they can’t reliably date a crash. Some measures may move ahead of market stress; others describe conditions as they unfold or confirm deterioration after it has begun. Their usefulness depends on what they measure, how quickly the data changes, and whether other evidence supports the same interpretation.
Research on financial crises illustrates why indicator performance depends on the measure and the event being studied. The IMF’s Early Warning Indicators of Financial Crises examines indicators in the context of currency and banking crises. Those findings provide methodological context, but they don’t turn any measure into a dependable timer for a stock-market crash.
Correlation or historical precedence does not prove causation. An indicator may move before a downturn without causing it or reliably predicting the next one.
| Indicator family | Signal | Limitation | Interpretation |
|---|---|---|---|
| Volatility and options | Expected near-term price movement or demand for protection rises. | Can increase during short-lived uncertainty and doesn’t show the direction of prices. | Read alongside price behavior and other measures of stress. |
| Credit conditions | Spreads widen, suggesting investors demand more yield for taking credit risk. | May respond to changing liquidity or borrower concerns without a broad market decline. | Check whether the change persists and appears across credit measures. |
| Market breadth and trends | Fewer securities participate in gains, or prices weaken. | Can reflect narrow leadership or a temporary shift, not necessarily an imminent crash. | Assess how broad and sustained the weakness is. |
| Economic and credit outcomes | Reported activity or borrower performance deteriorates. | Often arrives with a reporting delay and may describe conditions that have already changed. | Use as confirmation, while accounting for the data’s timing. |
False positives, late signals, and conflicting readings
A warning can persist while prices continue rising because markets may be supported by earnings, liquidity, or changing expectations even as one risk measure worsens. Conversely, lagging data such as reported defaults may confirm deterioration only after financial conditions have shifted. If indicators disagree, check what each measures and when it updates. Don’t select the most alarming reading just because it appears to offer a clear prediction.
How to judge a signal without treating it as a forecast
Start with the indicator’s measurement window. A short-term volatility gauge and a slower-moving credit measure are not expected to respond at the same time. Compare each reading with its own historical range, then ask whether independent measures point to a similar broad condition. For example, weakening breadth alongside widening spreads may merit closer review than either movement alone, but it still doesn’t establish what happens next.
Record the reading, its date, the condition it measures, and what evidence would change your interpretation. This separates observation from conclusion. Historical patterns can help frame risk, but market conditions evolve. Keep the assessment provisional rather than treating it as a personalized instruction to buy or sell.
Monitor market crash indicators without overreacting
A useful review process turns scattered readings into a consistent record. It doesn’t require constant monitoring. Set a regular interval that fits your investment process, such as a weekly or monthly review, and use the same definitions each time. Between reviews, distinguish new market evidence from headlines designed to capture attention.
A repeatable framework for reviewing market risk
Use the same sequence at each review. Begin with broad market direction, then check volatility, breadth, credit, and rates. The order matters less than applying it consistently and recording what each measure actually indicates.
- Define the question. For example: Is market risk broadening, or has one indicator moved in isolation? A clear question keeps the review focused.
- Review signal groups. Note broad price direction, then assess volatility, market participation, credit conditions, and interest rates. Record the date, reading, and measurement window.
- Assess confirmation. Mark each group as confirming the same risk condition, contradicting it, or adding no new information. Don’t count several closely related measures as fully independent evidence.
- Record your interpretation. State what changed, what remains uncertain, and what future evidence would alter your assessment. This makes the next review a comparison, not a fresh reaction.
Consistent definitions are essential. If you change the lookback period or the way you measure breadth between reviews, apparent changes may reflect the method rather than the market. A simple log helps distinguish a one-time fluctuation from a sustained shift. For a deeper look at broader economic measures that can frame this process, consult the macro market risk indicators guide.
Separate market evidence from headlines and personal decisions
Policy comments belong in the context column, not the signal column by themselves. Statements from Jerome Powell or other policymakers can affect expectations about inflation, interest rates, and economic conditions. But markets respond to how new information compares with what investors already expected. A statement alone doesn’t dictate the market’s next move.
Likewise, a broad market observation is not automatically a portfolio instruction. Whether a change matters to an individual depends on factors such as goals, time horizon, liquidity needs, and risk tolerance. Keep those personal considerations distinct from evidence about market conditions. This separation helps prevent a dramatic headline from becoming an unexamined decision.
For a wider discussion of interpreting signals within a long-term process, see this guide to evidence-based market timing. The aim is disciplined monitoring, not certainty: market crash early warning indicators can help organize risk information, but they can’t establish a crash date or guarantee an outcome.
How a systematic market signal turns warning indicators into risk context
Knowing what individual indicators measure is only part of the work. The next challenge is interpreting them consistently, without letting a striking headline or unusual reading dominate the assessment. A systematic market signal can provide a repeatable reference point for monitoring market health and drawdown risk. Its purpose is to organize risk context, not identify an exact crash date.
Alpha Shield Market Signal and the Alpha Shield Dashboard support this kind of monitoring. They give investors a structured way to follow market-risk information over time rather than relying only on ad hoc interpretations. The value is in a consistent process, not a promise that a market event can be forecast with certainty.
What a systematic signal can add to indicator monitoring
A defined signal offers a stable reference for reviewing changing conditions. Instead of treating each headline as a new verdict, investors can use a consistent framework to put information in context and compare assessments over time. The dashboard provides a consistent format for viewing market health and drawdown risk, helping make monitoring more orderly without implying that every market factor is captured or that any one reading determines what happens next.
For a disciplined review, separate the signal’s role from your interpretation of it:
- Use it as context. Treat the signal as one input to risk awareness, not an instruction to trade.
- Compare observations over time. A consistent reference can help distinguish a changing risk backdrop from a reaction to a single headline.
- Keep uncertainty visible. A signal can organize information, but it cannot remove ambiguity or guarantee advance notice.
- Connect it to your process. Decide how market-risk information fits into your broader long-term planning before conditions become stressful.
Where a market signal fits in long-term risk management
A market signal is decision support, not a complete investment plan. It does not account for every investor’s objectives, time horizon, liquidity needs, or tolerance for risk. Investors remain responsible for decisions suited to their own circumstances. Alpha Shield is designed for systematic monitoring and long-term capital preservation. It is not a day-trading tool, a shorting strategy, or a source of individual stock recommendations. It does not guarantee crash prediction, loss prevention, or investment results.
Used with clear expectations, market crash early warning indicators and a systematic signal can help frame questions about market health without turning uncertainty into a forecast. To learn more about the approach, explore Alpha Shield Market Signal.
Make your next market review more disciplined
The next time market conditions shift, start with a clear process rather than reacting immediately. Decide what you want to monitor, set a regular review interval, and record what changes. This creates room to assess new evidence calmly instead of letting each headline reset your view. Market crash early warning indicators are useful for measured risk awareness, not as a replacement for judgment or a promise of certainty.
Alpha Shield’s approach reflects experience in global markets. Its founders are former investment bankers and global markets professionals. System development began in 2017, and Alpha Shield launched in 2019. The Alpha Shield Market Signal is designed to help investors monitor market health and drawdown risk as part of a longer-term process.
For a consistent reference in your market-risk reviews, explore how the signal works. A more deliberate process can help you assess changing conditions with greater clarity.
Frequently Asked Questions
Can market indicators predict a crash before it happens?
They can signal rising vulnerability, but they can’t reliably predict a crash in advance. Market crash early warning indicators vary in timing: some react to expectations, while others depend on data that becomes available later. For example, a jump in volatility may show that investors expect larger price swings, not that a crash is certain. Treat indicators as inputs for ongoing risk review, not advance notice of a specific event.
What is the most reliable early warning indicator of a market crash?
There isn’t one indicator that is consistently reliable across every market environment. A measure may be useful for tracking one condition, such as credit stress, but less informative about price direction or timing. Consider whether the measure fits your question, how quickly it updates, and whether its definition has changed. Reliability means more than a striking historical example; it also depends on how often a signal misleads or arrives too late.
Does a rising VIX mean a market crash is coming?
No. A rising VIX indicates that options prices imply greater expected near-term S&P 500 volatility. It does not specify whether the index will rise or fall, and it can climb during uncertainty that later subsides. Compare the move with its recent range and check whether other evidence is changing too. A brief VIX spike and a sustained shift in broader market conditions are different observations, even if both attract dramatic headlines.
Can the Treasury yield curve warn investors about a recession or crash?
It can contribute economic context, but it can’t establish that a recession or stock-market crash will follow. The curve compares Treasury yields across maturities; its slope changes as interest rates and expectations change. If you track it, specify which maturities you’re comparing and use the same spread over time. A curve signal relates to economic risk, while equity prices can respond to additional factors and follow a different path.
How many indicators should investors monitor for market risk?
There’s no universal number. A useful set covers distinct sources of information without overwhelming the review or counting near-duplicate measures as separate confirmation. For instance, tracking several volatility gauges may add less perspective than pairing a volatility measure with a credit or breadth measure. Choose indicators you can define clearly, access consistently, and interpret within your time horizon. A concise, understood dashboard is more useful than a long list checked without a process.
Are Federal Reserve announcements, including Jerome Powell's comments, crash indicators?
No. A Federal Reserve announcement is policy information, not a crash indicator by itself. Its market effect depends partly on how the decision or comments compare with expectations already reflected in prices. For example, unchanged rates may still prompt a market reaction if the accompanying outlook differs from what investors anticipated. Read the statement for its policy context, then observe how relevant markets respond rather than treating a single quote as a forecast.
What should investors do when several market warning indicators worsen?
First, verify that the readings use current data and comparable definitions. Then note whether the changes persist and affect genuinely different parts of the market. Review your written investment plan and the assumptions behind it rather than making an immediate decision based on a cluster of headlines. If the signals raise questions about your personal allocation, consider discussing them with a qualified financial professional who understands your circumstances.


