
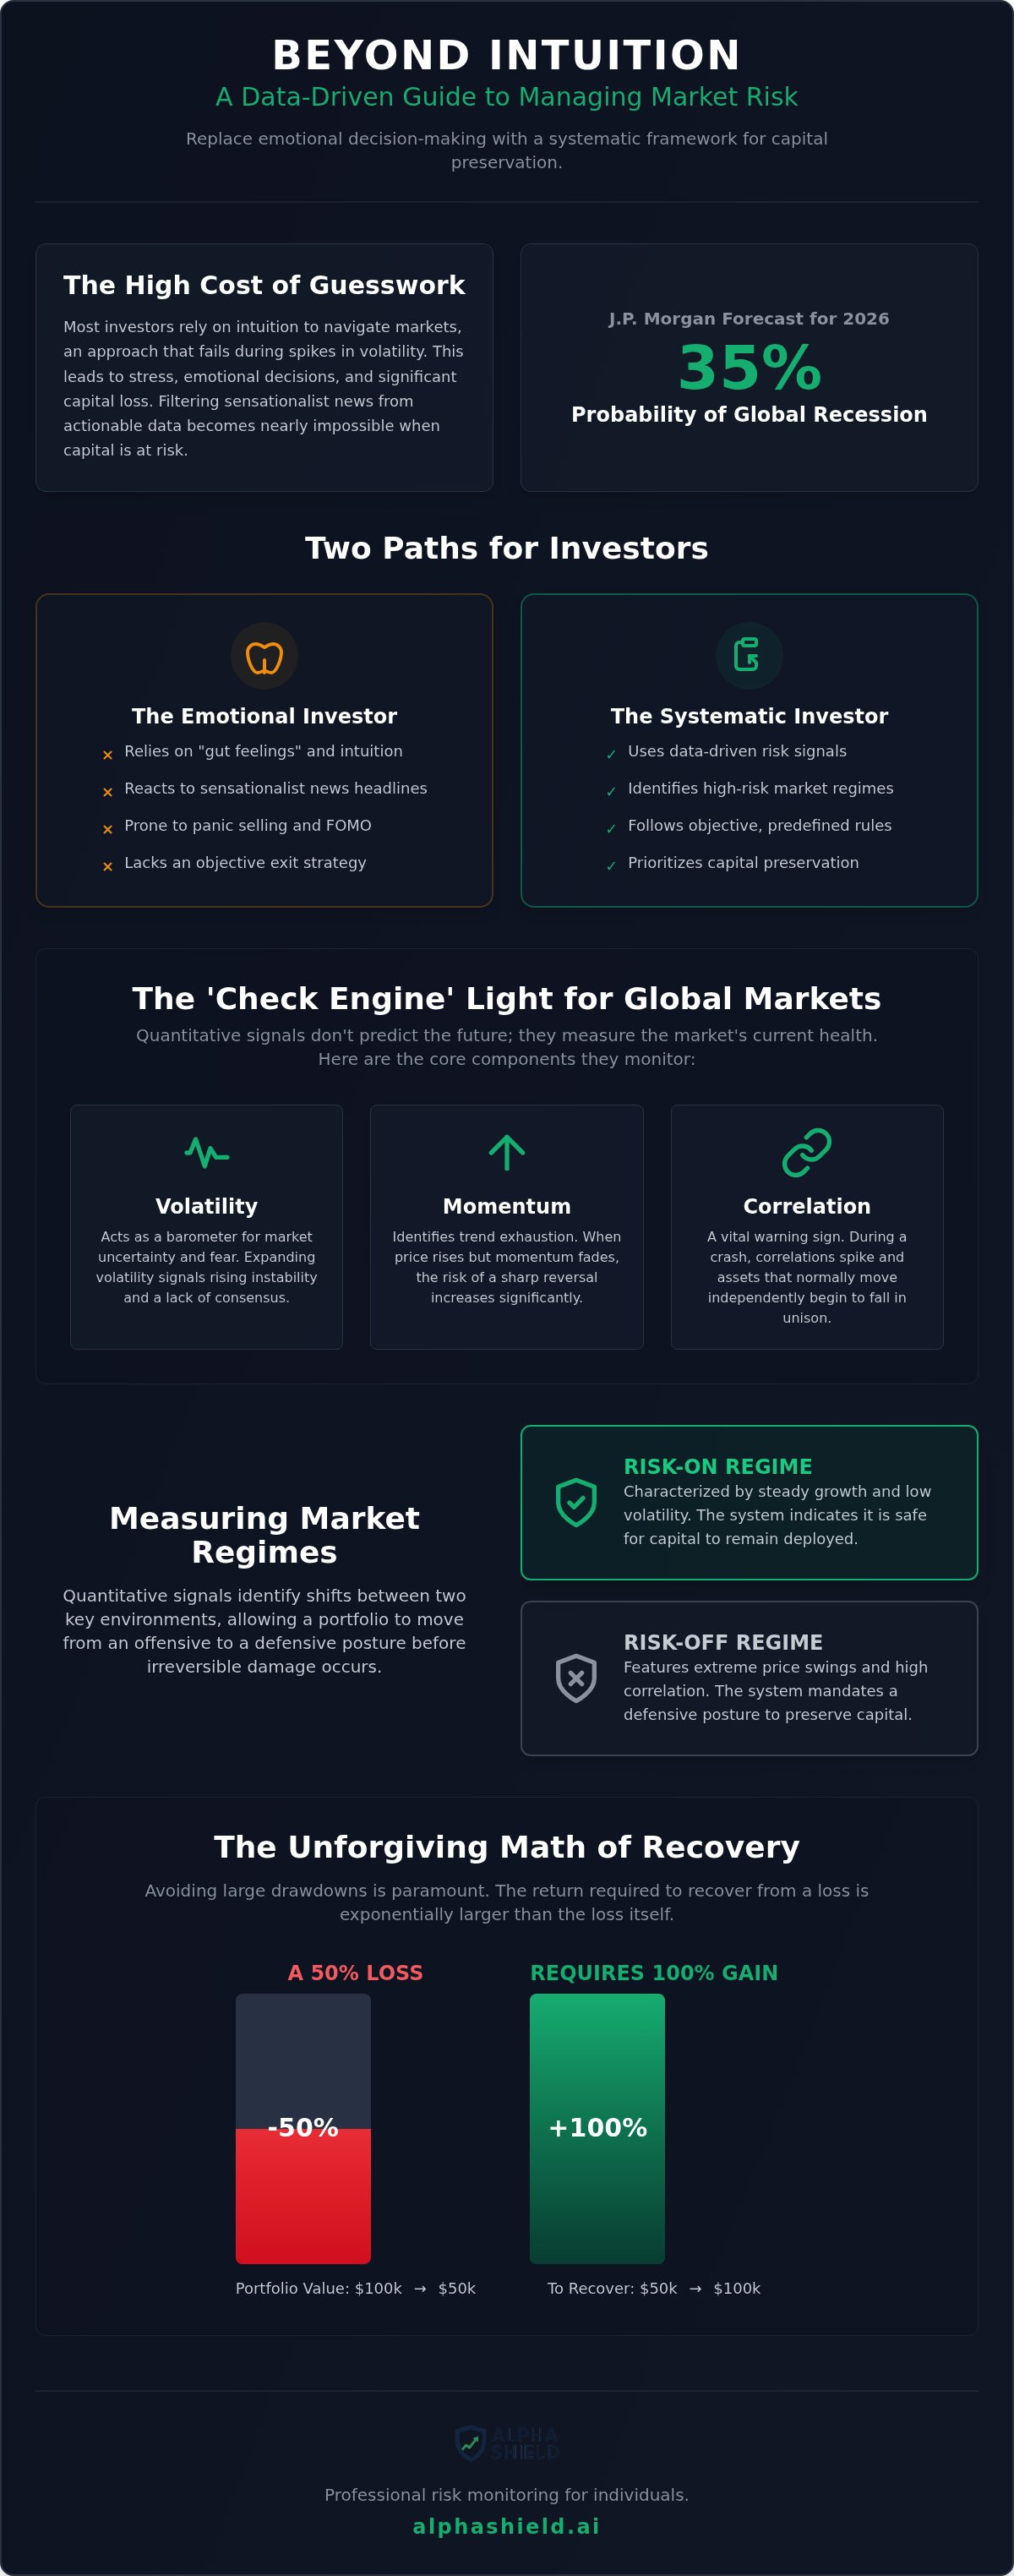
Most investors believe they can sense a market crash before it happens, but intuition is a liability when volatility spikes. With J.P. Morgan forecasting a 35% probability of a global recession in 2026, the cost of being wrong has never been higher. You've likely experienced the stress of sudden drawdowns and the exhaustion of filtering through sensationalist financial news. It's difficult to maintain discipline when your capital is at risk and the media environment is designed to trigger emotional reactions.
This article provides a systematic alternative to the noise. You'll learn how to use quantitative market risk signals to identify high-risk regimes and protect your portfolio from catastrophic drawdowns. Our focus is on data-driven objectivity rather than speculative excitement. If the signals indicate a deteriorating environment, the system mandates a defensive posture. We will provide a clear framework for measuring market health and establishing objective rules for capital preservation. By the end of this guide, you'll understand how to replace emotional decision-making with a rational, rule-based approach to risk management.
Key Takeaways
- Don't rely on intuition; replace it with objective, data-driven monitoring to identify high-risk market regimes.
- Use quantitative market risk signals to measure the probability of significant drawdowns with institutional precision.
- Protect your portfolio from emotional bias by filtering out sensationalist news headlines that don't prioritize accuracy.
- Establish a systematic framework for capital preservation by defining objective rules for market participation.
- Simplify complex global data into a single, actionable signal that provides clarity during periods of extreme volatility.
What are Quantitative Market Risk Signals?
To understand the context of disciplined investing, we must first define What are Quantitative Market Risk Signals? These are objective data points used to measure the probability of significant market drawdowns. For decades, retail investors relied on qualitative "gut feelings" or the intuition of media personalities. This approach is inherently flawed. It introduces emotional bias into a process that requires clinical objectivity. Modern professionals have shifted toward quantitative market risk signals to replace speculation with data-driven monitoring. This transition ensures that capital preservation is based on measurable facts rather than hopeful narratives.
These signals serve as the foundation of institutional risk management. Large-scale global market players don't guess. They calculate. It's critical to distinguish between "predictive" indicators and "regime-identifying" signals. Predictive indicators attempt to forecast the future, which is often a futile exercise in complex systems. Regime-identifying signals measure the current health of the market environment. If the data indicates a high-risk regime, the system mandates a defensive posture. If the regime is healthy, capital remains deployed. This binary logic removes the stress of decision-making during periods of high volatility.
The Mechanics of Quantitative Risk Assessment
Algorithms process vast datasets to filter market noise and isolate meaningful trends. This systematic approach strips away the sensationalism found in financial headlines. Reliability is established through rigorous historical backtesting. At Alpha Shield, our system development started in 2017 to ensure our logic survives various market cycles. Quantitative signals are the check engine light for global markets. They don't predict the destination of the journey; they tell you if the vehicle is currently safe to operate. When the light turns red, a disciplined professional stops the car. Ignoring the signal is a choice to accept catastrophic failure.
Core Components: Volatility, Momentum, and Correlation
Three primary metrics form the core of any robust risk assessment. Volatility acts as a barometer for market uncertainty and fear. When volatility expands, it suggests a lack of consensus and rising instability. Momentum signals identify trend exhaustion. If price action continues to rise while momentum fades, the risk of a sharp reversal increases. Finally, correlation is a vital warning sign. During a market crash, correlations typically spike. Assets that usually move independently begin to fall in unison. Signals detect this convergence early. By monitoring these variables, investors can move from a state of reactive panic to one of proactive discipline.
Measuring Market Regimes: The Science of Risk Identification
Markets operate in distinct regimes. A low-risk environment is characterized by steady growth and low volatility. A high-risk environment features extreme price swings and high correlation between asset classes. Traditional diversification often fails during these shifts. When a crash begins, everything falls together. This is why Implementing a Systematic Risk Management Framework is essential for long-term survival. Quantitative market risk signals identify these transitions in real-time, moving portfolios from "Risk-On" to "Risk-Off" before the damage becomes irreversible.
Volatility is not distributed evenly. It clusters. High volatility today increases the probability of high volatility tomorrow. This phenomenon is a core reason why capital preservation requires a mechanical response. If volatility spikes, the risk of a catastrophic drawdown increases exponentially. Our quantitative market risk signals monitor these clusters to enforce discipline. It's not about predicting a specific event; it's about measuring the current level of danger in the system.
The Failure of Buy-and-Hold in Extreme Drawdowns
The math of recovery is unforgiving. If your portfolio loses 50%, you don't need a 50% gain to recover. You need 100%. For most investors, this recovery process takes years. Retail investors often fall into the "hope" trap, staying fully invested during a crash. Institutions use regime identification to avoid this catastrophic error. They treat drawdown management as a technical requirement. By identifying a high-risk regime early, you can exit the market and wait for stability. This protects your principal and ensures you aren't fighting to break even for the next decade.
VIX and Term Structure as Risk Proxies
Many traders look at the VIX as a simple fear gauge. This is a limited approach. While a high VIX suggests fear, it doesn't always signal a regime shift. Professional systems analyze the VIX futures curve, or term structure. If short-term volatility is priced higher than long-term volatility, the risk regime has shifted fundamentally. We use these volatility metrics to calibrate exposure with precision. You can view these institutional metrics in a simplified format through the Alpha Shield Market Signal dashboard. This level of clarity helps you ignore news noise and focus on objective data.
Quantitative Signals vs. Financial News Headlines
Financial media is a business of engagement. It thrives on urgency and fear to capture attention. This creates a "noise" problem where every minor price fluctuation is treated as a major crisis. In contrast, quantitative market risk signals operate on mechanical data. They ignore the narrative and focus on the math. By Measuring Market Regimes: The Science of Risk Identification, investors filter out the static of sensationalist headlines. A data signal is more reliable than a central bank headline because the signal reflects actual market mechanics rather than political signaling. The media wants you to react. The signal wants you to calculate.
Think of signals as a subtraction tool. They remove the 90% of information that has zero impact on long-term returns. Emotional bias often manifests as panic selling during temporary dips or FOMO buying at market peaks. These reactions are driven by headlines, not market health. Consider a scenario where news outlets report a potential recession based on a single survey. A reactive investor might panic sell based on fear. A systematic investor waits for the signal. If the signal remains green, you stay invested. If the signal turns red, you exit. The signal-based exit is clinical. The news-based reaction is emotional. One is a professional maneuver. The other is a retail gamble.
Objectivity as a Competitive Advantage
Narrative-based investing is dangerous. It relies on stories, and stories are often wrong. Human ego wants to be "right" about a prediction. A rules-based system removes that ego entirely. It doesn't care about your opinion or the latest expert panel. If the risk threshold is breached, the system acts. This objectivity is a significant competitive advantage in a world driven by social media trends and 24-hour news cycles. Professionals use these tools to maintain emotional detachment. They treat fear and greed as variables to be managed, not experiences to be shared.
Systematic Discipline in Volatile Times
Markets often become irrational. During these periods, maintaining sober transparency is your only defense. There is immense psychological relief in having a pre-defined exit signal. You don't have to wonder if it's time to get out. The signal tells you. This reduces the mental load of complex decision-making. It prevents the stress of second-guessing. Systematic signals don't just protect your money. They foster the discipline required for multi-decade growth. When you follow a process, you replace chaos with clarity.
Implementing a Systematic Risk Management Framework
Implementing a framework requires moving from abstract concepts to mechanical execution. Most investors fail not because they lack data, but because they lack a protocol for using it. A systematic approach ensures that you act with the same discipline as an institutional desk. By following a structured process, you replace the chaos of the market with the clarity of a rule-based engine.
Step 1: Define your "Maximum Tolerable Drawdown" as a baseline. This is the specific percentage of loss your portfolio can sustain before your long-term goals are compromised. It's your line in the sand. Without this number, you'll hesitate when markets turn volatile.
Step 2: Select objective quantitative market risk signals that align with long-term capital preservation. These signals must be based on measurable market mechanics like volatility clustering and momentum exhaustion rather than media opinion. You need a signal that has been battle-tested through multiple market cycles.
Step 3: Establish a binary "In/Out" or "De-risking" protocol based on signal triggers. If the signal is green, you maintain your exposure. If it's red, you de-risk. There's no middle ground and no room for "wait and see" behaviors. This binary logic is the only way to bypass the emotional stress of a falling market.
Step 4: Automate the monitoring process to avoid discretionary hesitation. The goal is to remove the human element from the final decision-making process. When the system says exit, you exit. You don't consult the news or wait for the next Federal Reserve meeting. You follow the math.
Transitioning from Discretionary to Systematic
Professional investors often struggle with "pulling the trigger" on an exit. The fear of being wrong or missing a rebound causes paralysis. A rules-based system solves this by treating market conditions as variables to be managed rather than experiences to be shared. Using the Alpha Shield Dashboard simplifies complex institutional data into a single, actionable instruction. This allows you to integrate professional risk monitoring into your existing brokerage or 401k management without needing an advanced degree in finance. You don't need to be a mathematician to benefit from mathematical discipline.
Monitoring Market Health Daily
Systematic management doesn't require constant attention. It requires a steady, predictable routine. Checking a market health indicator once a day is enough to maintain discipline. This isn't day-trading. It's a professional health check for your capital. Focusing on capital preservation as the primary driver of long-term wealth is a vital mindset shift. Most retail investors focus only on gains, but professionals know that avoiding the big loss is more important than catching every small rally. You can start monitoring your portfolio's safety today with the Alpha Shield Market Signal.
Alpha Shield: Professional Risk Monitoring for Individuals
Alpha Shield decodes institutional complexity into a single, actionable instruction. Our founders possess over 50 years of collective experience in global markets and investment banking. They observed how sudden drawdowns destroy decades of accumulated wealth. This insight moved us to prioritize capital preservation above all else. We began system development in 2017 to create a non-discretionary risk assessment tool. Our engine operates with clinical detachment. It serves as a rational anchor when markets become irrational.
The Alpha Shield Dashboard visualizes global risk with sober transparency. It strips away the noise of financial media. We don't participate in the speculative excitement of retail trading. Our philosophy is rooted in systematic discipline. If the data indicates a high-risk regime, the signal turns red. If conditions are stable, the signal stays green. This binary clarity is the foundation of institutional-grade protection. By using quantitative market risk signals, we help you manage volatility as a variable rather than an emotional experience.
Simplicity as a Luxury
True professional achievement lies in the reduction of complex data into actionable steps. We process thousands of variables to maintain a clear "Risk-On/Risk-Off" framework. Our commitment is to "anti-hype" communication. We don't sell stock picks. We don't sell shorting strategies. We don't offer day-trading tools. We provide the specific quantitative market risk signals required to avoid catastrophic errors. You can Explore the Alpha Shield Dashboard to see how we filter the noise of the global markets and provide a clear path to understanding.
Joining the Disciplined Few
Professional risk management is a daily routine. A subscription to our risk warning system provides a steady pulse of objective data. It ensures you aren't guessing when the next drawdown arrives. Most investors are reactive; the disciplined few are systematic.
- Access a single, actionable signal for market health.
- Reduce the emotional stress of making exit decisions.
- Follow a battle-tested system developed since 2017.
Getting started takes under five minutes. You can Secure your portfolio with Alpha Shield today and transition from reactive fear to data-driven objectivity. This is not a gamble. It's a methodical approach to long-term security.
Secure Your Financial Future Through Systematic Discipline
Capital preservation is the result of professional rules, not luck. You now understand how regime identification replaces emotional guesswork and how institutional data filters out the noise of sensationalist media. Relying on quantitative market risk signals ensures that your portfolio remains protected during periods of extreme volatility. This systematic approach allows you to act with the same clinical detachment as a global markets desk.
Alpha Shield was built by former investment bankers with over 50 years of collective experience. Our platform focuses exclusively on drawdown avoidance to protect the wealth you've worked hard to accumulate. Our proprietary dashboard is designed for clarity and discipline, stripping away complexity to provide a single, actionable instruction. It's time to replace the stress of decision-making with a rational, rule-based engine.
Access Institutional-Grade Risk Signals with Alpha Shield and gain the clarity needed to navigate any market environment. You have the tools to move from reactive fear to proactive calculation. Take the first step toward a more secure and disciplined investment future today.
Frequently Asked Questions
What is the difference between a market signal and a stock alert?
A market signal measures the health of the entire financial environment, whereas a stock alert focuses on individual company price action. Alpha Shield provides quantitative market risk signals to help you understand the broader regime. Stock alerts often encourage frequent trading and speculation. In contrast, our signal is a professional tool designed for capital preservation. It tells you whether the overall market environment is safe or hazardous for your portfolio.
Can quantitative signals prevent all investment losses?
No system can eliminate every minor fluctuation, but quantitative signals are designed to prevent catastrophic drawdowns. The goal is to identify regimes where the probability of a significant crash is elevated. By de-risking during these periods, you avoid the large losses that destroy long-term wealth. Market risk is always present; however, systematic discipline allows you to manage that risk clinically rather than reacting to emotional stress.
How often do these market risk signals change?
These signals don't change with every daily price tick because they track structural regime shifts. Market regimes are more stable than individual stock prices. You might see a signal change only a few times a year when the underlying mechanics of volatility and correlation shift fundamentally. This slow, methodical pace prevents over-trading. It ensures you only act when the data indicates a genuine change in the market's health.
Do I need a background in finance to use quantitative signals?
You don't need a finance degree to benefit from professional risk monitoring. Alpha Shield translates complex institutional data, such as VIX term structure and volatility clustering, into a single, actionable signal. Our dashboard is designed for clarity, allowing individual investors to follow a rule-based framework without needing to decode the math themselves. Simplicity is a luxury we provide to ensure you can make disciplined decisions in under five minutes.
Are these signals suitable for retirement accounts like 401ks?
Yes, these signals are highly effective for managing retirement accounts like 401ks or IRAs. Since these accounts are focused on long-term growth, avoiding a 50% drawdown is critical for staying on track. Using quantitative market risk signals allows retirement investors to move to defensive positions when the regime becomes high-risk. This protects your principal and ensures you aren't spending years trying to break even after a crash.
Is Alpha Shield a day-trading or shorting service?
Alpha Shield is strictly a capital preservation tool and does not offer day-trading tools or shorting strategies. We are an anti-hype service that prioritizes sober transparency over speculative excitement. Our system doesn't encourage frequent trading or aggressive bets against the market. Instead, it provides a rational anchor for investors who value consistency and the avoidance of catastrophic errors. We focus on when to be in the market and when to be out.
How do quantitative signals handle "Black Swan" events?
While "Black Swan" events are by definition unpredictable, they often manifest through rapid spikes in volatility and correlation. Quantitative signals are designed to detect these mechanical shifts as they occur. By monitoring the "check engine light" of global markets, the system identifies the transition into a high-risk regime. This allows you to exit or de-risk early in the event's progression, significantly reducing the impact of the tail-risk event on your capital.
What data sources are used to generate these risk signals?
Our proprietary signals are generated using high-quality institutional data sources focused on market mechanics. We analyze variables such as volatility metrics, momentum exhaustion, and price correlation across global asset classes. This data-driven approach removes the noise of financial news headlines. By filtering thousands of data points into a single instruction, we provide the same level of analytical rigor used by professional global markets desks since our development began in 2017.


