

What if a strong-looking warning sign still can’t tell you when a market will turn? Market peak indicators can highlight rising risk, but no single reading provides a reliable timestamp. Conflicting headlines and compelling individual signals make it easy to mistake a clue for a forecast.
Which indicators matter, and how much confidence should you place in them? The answer depends on context. Valuations, market breadth, investor sentiment, volatility, and economic conditions each reveal different pressures, and their signals can conflict.
This guide explains the main families of market peak indicators, how they differ between stocks and crypto, and how to assess them without chasing the top. You’ll find a repeatable way to look for confirmation across multiple signals, consider what each can and can’t tell you, and monitor risk without reacting to every market move. The goal isn’t to predict an exact turning point. It’s to read the evidence with discipline.
Key Takeaways
- Market peak indicators measure different conditions, from valuation and sentiment to economic pressure and market structure.
- Use market peak indicators as evidence of changing risk, not as forecasts or precise instructions to time a market top.
- Stock and crypto signals reflect different market mechanics, so interpret each within its own asset-class context.
- Build a repeatable review: identify a signal, check its context, compare independent evidence, and track it over time.
- Systematic risk monitoring can help you observe market health and drawdown conditions without chasing every move.
What Are Market Peak Indicators, and What Can They Actually Tell You?
A market peak indicator is evidence that risk may be increasing or that market conditions may be changing. It might reflect stretched valuations, weakening participation, rising volatility, or economic pressure. The signal describes a condition; it doesn’t establish what happens next.
A market peak indicator is a measurable sign of elevated risk or a possible market-regime change, not proof that a peak has occurred or a forecast of when one will. A warning sign calls for attention. Confirmation means additional evidence supports a developing interpretation. Neither offers certainty or a precise market-timing instruction.
Each measure answers a different question. A valuation measure may suggest prices are high relative to a chosen benchmark. A breadth measure may show that fewer shares are supporting an index’s advance. Neither tells you, on its own, whether conditions will deteriorate soon. For an overview of how market cycles and related measures are discussed, see Stock market cycles and indicators.
Several independent signals can make a risk assessment more substantial, especially when they point to related pressures. For example, weakening participation alongside deteriorating economic conditions may deserve closer attention than either observation alone. But indicators can overlap, lag, or disagree. Convergence is a reason to monitor risk more closely, not a guarantee of a turning point.
How Is a Market Peak Different from a Temporary Pullback?
A pullback is a decline within a market’s broader movement. A peak marks a possible transition from one regime to another, such as a sustained advance giving way to a broader decline or a prolonged period of weakness. One down day, a sharp weekly drop, or a new high followed by a dip can’t establish that boundary. Look at how prices, participation, and market conditions develop over time. The outline of a cycle is often clearer in hindsight than in real time.
Why No Indicator Can Mark the Exact Top
Markets can keep rising while risk measures flash warnings. An early signal may stay elevated as prices advance, or ease without a major decline. That doesn’t necessarily make it useless: the measure may describe vulnerability rather than timing. Treat an indicator as input to risk awareness, not as certainty or personalized investment advice. Any portfolio decision depends on your circumstances and investment plan, not a single reading.
Which Market Peak Indicators Matter, and What Does Each Measure?
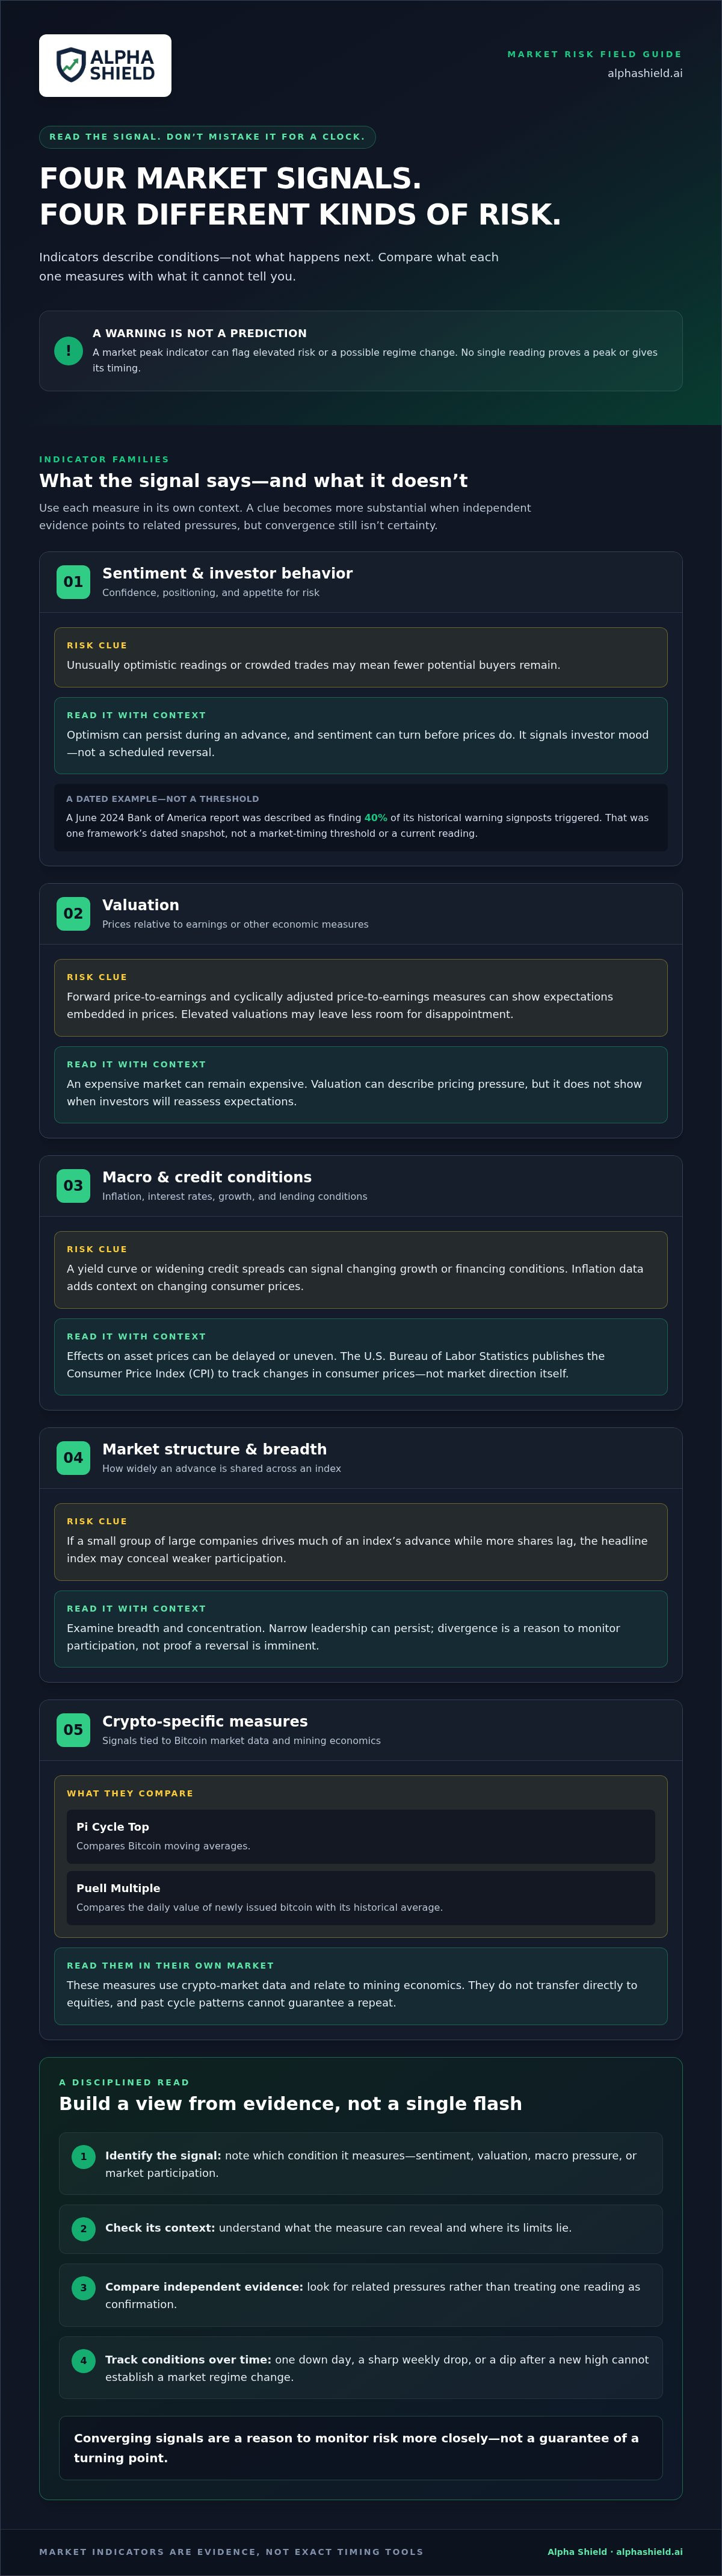
Useful market peak indicators are grouped by what they measure, not by any claim that they can predict a top. Sentiment tracks investor appetite for risk. Valuation gauges prices against earnings or other economic measures. Macroeconomic indicators describe conditions such as inflation, interest rates, and credit availability. Market-structure measures reveal whether an advance is broad or depends on a narrow group of assets. Each family offers a different perspective, and each has limits.
Sentiment and Investor-Behavior Indicators
Sentiment measures capture confidence, positioning data shows how investors are allocated, and risk-appetite measures track demand for more volatile assets. Unusually optimistic readings can be a caution signal if investors appear crowded into similar trades, leaving fewer potential buyers. But optimism can persist during an advance, and sentiment can turn before prices do. A June 2024 Bank of America report was described as finding 40% of its historical warning signposts triggered. That figure is a dated snapshot of one framework, not a market-timing threshold or a current reading.
Valuation, Macro, and Market-Structure Indicators
Valuation ratios, such as forward price-to-earnings or cyclically adjusted price-to-earnings measures, help assess the expectations embedded in prices. Elevated valuations may leave less room for disappointment, but they don’t identify when investors will reassess those expectations. A yield curve or widening credit spreads can signal changing growth or financing conditions, but they don’t date an equity-market peak. Inflation data adds context: the U.S. Bureau of Labor Statistics publishes the Consumer Price Index (CPI) as a market indicator, which helps track changes in consumer prices, not market direction itself.
Market structure asks who is driving an index. If a small group of large companies accounts for much of its advance while more shares lag, the headline index may conceal weaker participation. That divergence is a reason to examine breadth and concentration, not proof that a reversal is imminent.
Crypto requires measures designed for its own market mechanics. The Pi Cycle Top indicator compares Bitcoin moving averages, while the Puell Multiple compares the daily value of newly issued bitcoin with its historical average. Both use crypto-market data and relate to mining economics. They don’t transfer directly to equities, and past cycle patterns can’t guarantee a repeat.
- Sentiment: How confident or risk-seeking investors appear. Limitation: confidence can stay high as prices rise.
- Valuation: What prices imply about earnings or economic output. Limitation: expensive markets can remain expensive.
- Macro and credit: Whether inflation, rates, and lending conditions are shifting. Limitation: effects on asset prices can be delayed or uneven.
- Market structure: Whether gains are broadly shared or concentrated. Limitation: narrow leadership can persist.
Together, these indicator families reveal investor behavior, pricing expectations, economic pressure, and market participation. None supplies a stand-alone forecast. For a consistent way to monitor risk conditions, explore the Alpha Shield Market Signal, a tool for monitoring market risk rather than calling an exact top.
Stock and Crypto Market Peak Indicators: A Comparison
Read market peak indicators in the context they were built to measure. Equity analysis often combines company valuations, investor sentiment, interest rates, credit conditions, and participation across shares. Crypto-cycle analysis may use blockchain data, issuance, or price relationships specific to an asset such as Bitcoin. Similar-sounding concepts don’t mean the underlying inputs or market mechanics are the same.
Comparable concepts do not make signals interchangeable across markets. Rising risk appetite, for example, can matter to both stocks and crypto, but the assets, participants, trading structures, and data behind a particular measure may differ. Before applying an indicator’s label to another market, check what it actually measures.
| Market context | Indicator examples | Useful question | Key limitation |
|---|---|---|---|
| Broad equities | Investor sentiment and positioning | Does confidence or exposure appear unusually one-sided? | Optimism can persist while prices continue rising. |
| Broad equities | Valuation measures | What expectations are reflected in prices? | Valuation is context, not a short-term timer. |
| Economic and credit backdrop | Yield curve and credit conditions | Are financing or growth conditions changing? | These signals don’t specify when equities may turn. |
| Crypto cycles | Pi Cycle and Puell Multiple | Are Bitcoin price-cycle or issuance-related measures at unusual levels? | Historical patterns may not repeat or apply to other assets. |
Reading Equity-Market Peak Signals
For equities, sentiment and positioning describe investor behavior, while valuation gauges prices against earnings or other benchmarks. Yield-curve measures compare interest rates across maturities; credit indicators track borrowing and lending conditions. Together, they help frame the market environment. A 2024 count of triggered warning signposts, for instance, belongs to that report’s date and methodology. It isn’t a current reading or a timeless threshold. Macroeconomic signals describe the backdrop, not a peak date.
Reading Crypto Cycle Signals
Pi Cycle and Puell Multiple are crypto-focused examples, particularly in Bitcoin-cycle analysis. They use relationships tied to crypto prices and issuance economics rather than corporate earnings or the breadth of a stock index. Their historical patterns can inform a crypto-specific assessment, but they aren’t universal market gauges. Don’t transfer a Bitcoin signal directly to equities or assume it behaves the same way across digital assets.
Compare indicators by asking what data they use, what market behavior they describe, and what limitations apply. This keeps cross-market comparisons grounded: use a measure within its intended context, then assess whether other independent evidence supports the same interpretation.
How Should Investors Interpret Market Peak Indicators Without Overreacting?
A disciplined review turns an indicator reading into a question, not an immediate instruction. Start by identifying what the signal measures. Then check whether the surrounding evidence supports the same interpretation. If readings conflict, confidence in a single peak thesis should fall, rather than rise through selective interpretation. This process separates observation from action: indicators inform risk awareness, but they don’t determine an individual investor’s portfolio decisions.
A Four-Step Framework for Evaluating a Potential Peak
Use the same sequence each time a reading attracts attention. A consistent process makes it easier to compare current evidence with earlier observations without letting a headline reset your approach.
- Identify the signal. Write down what it measures, its data source, and the asset class it addresses. A crypto-specific measure, for example, shouldn’t be treated as an equity-market gauge.
- Check the context. Is the reading isolated, persistent, or supported by separate evidence? Note whether other measures reflect the same risk. Several versions of one underlying factor don’t amount to independent confirmation.
- Record the limits. Understand the indicator’s timing horizon and what could make it misleading. Keep historical examples separate from current readings; past patterns are context, not a promise of repetition.
- Review through a predefined process. Compare the evidence with established risk criteria and review it at consistent intervals. Don’t change course solely because a headline labels a reading an “urgent” warning.
Then state your conclusion narrowly. For example: “This measure suggests weakening participation, but other evidence has not confirmed a broader deterioration.” If the signal fades, record the change. If independent indicators begin to align, reassess your risk view. Either way, revise your assessment in response to evidence, not a desire to defend an earlier call.
Common Interpretation Errors to Avoid
A high reading doesn’t prove a top has formed, and a lower reading doesn’t automatically mean risk has passed. Indicators can use different scales and time horizons, so combining them into one score without a clear method can create false precision. Historical patterns can help frame possibilities, but market structure and conditions change. A past match doesn’t guarantee future behavior.
Another common error is treating repeated measures as independent confirmation. Several sentiment surveys may reflect much the same investor mood. A sentiment reading alongside a distinct change in credit conditions may provide a broader view, though it still can’t establish timing. Check what each signal contributes before treating agreement as meaningful.
For a wider set of risk measures and guidance on assessing them, use this market crash early warning indicators guide as a companion reference. The aim isn’t to react to every warning. It’s to track evidence, uncertainty, and changes in risk through a process you can apply consistently.
From Peak Signals to Systematic Risk Monitoring
Market risk isn’t a single event that can be captured by naming the top. It changes over time. A more practical objective is to monitor conditions consistently, assess whether risk is building or easing, and review that information through a defined process. This shifts the focus from guessing a turning point to managing exposure to changing market conditions.
Market peak indicators can stay elevated while prices continue rising, fade before a downturn, or offer conflicting readings. A monitoring process gives those signals a place in a broader assessment. It doesn’t remove uncertainty, and it shouldn’t turn every indicator change into a portfolio instruction.
What a Market Risk Dashboard Can, and Cannot, Do
A dashboard can organize market-health information into a consistent view, making it easier to observe risk conditions over time instead of reacting to disconnected headlines. Alpha Shield Market Signal and the Alpha Shield Dashboard are designed to support monitoring of market health and drawdown risk. They provide information for risk assessment, not a guarantee of protection from losses or a promise to identify an exact top.
Systematic monitoring is different from individualized financial advice. A signal can inform your understanding of market conditions, but it doesn’t determine what you should do. Decisions depend on individual circumstances, objectives, and an established investment plan. Alpha Shield focuses on long-term capital preservation, not day-trading tools, shorting strategies, or individual stock recommendations.
A Disciplined Next Step for Long-Term Investors
Define your monitoring routine before volatility rises. Decide which broad conditions you’ll review, how often you’ll revisit them, and how you’ll distinguish a new observation from a change that affects your risk assessment. Keep a record of what changed and why. A written process makes it easier to respond proportionately instead of letting a dramatic headline dictate your next move.
For a wider discussion of decision-making and market timing, see this evidence-based market timing guide. The underlying discipline is straightforward: monitor conditions, acknowledge uncertainty, and avoid treating any indicator as a precise forecast. A systematic, data-driven tool can support long-term risk monitoring, but it can’t remove market risk or replace your own plan.
To apply a consistent monitoring approach, explore Alpha Shield Market Signal.
Make Your Next Risk Review More Deliberate
Rather than waiting for a headline to demand a decision, choose a regular time to review market conditions and note what would make you reassess risk. That gives market peak indicators a defined role: they prompt a closer look, while your broader process determines whether the evidence has changed enough to matter. The objective isn’t to eliminate uncertainty. It’s to keep uncertainty from dictating your next move.
Alpha Shield was founded by investment banking and global markets professionals with more than 50 years of combined experience. System development began in 2017, and Alpha Shield launched in 2019. Its approach centers on systematic risk monitoring and long-term capital preservation, not a promise to call the top.
Build a monitoring routine that fits your investment plan, then review it consistently. Progress comes from measured decisions, not perfect timing.
Stay disciplined, keep learning, and let a clear process guide your next step.
Frequently Asked Questions
What are market peak indicators?
Market peak indicators are data points investors use to assess whether market risk or behavior may be changing. For example, an investor might track valuation alongside market breadth, then record whether both are weakening or only one has shifted. Their value comes from comparing readings over time and understanding how they’re calculated, not simply labeling a number “high.” No single measure captures every force affecting prices.
Can market indicators predict the exact top?
No. Indicators can’t reliably identify an exact market top in advance. A reading may remain elevated through further gains, while an apparently concerning condition may ease. For example, a valuation measure that stays above its usual range can flag sensitivity to disappointment without revealing when prices might respond. Treat that information as a reason to review assumptions, not proof that a turning point is imminent.
Which indicators are commonly used to assess a stock-market peak?
Investors commonly review sentiment and positioning, valuation, yield-curve information, credit conditions, and market breadth. Each helps answer a different question. Breadth, for instance, can show whether gains are shared across an index, while credit conditions offer clues about financing pressure. A practical review notes the timeframe and definition behind each reading, then checks whether the measures add distinct information or echo the same underlying factor.
Are crypto market peak indicators the same as stock-market indicators?
No. Some broad themes overlap, but the calculations and data can differ. Bitcoin analysis may use Pi Cycle or Puell Multiple, which draw on crypto-specific price or issuance information. Equity investors may instead examine corporate valuation and economic conditions. When comparing assets, first identify the inputs and intended market for each measure. A signal developed around Bitcoin’s cycle shouldn’t be assumed to explain stock-index behavior.
How many market peak indicators should investors follow?
There’s no universal number that makes a market assessment dependable. Start with a short list that serves distinct purposes, such as one measure of valuation, one of participation, and one of credit conditions. Then check whether each adds useful information. If several indicators respond to the same underlying data, counting them as separate confirmations can create a misleading sense of certainty.
What happens if market peak indicators disagree?
Disagreement means the evidence is mixed. Valuations may look stretched while market breadth remains firm, for example. Note what each measure captures and whether their time horizons differ; one may respond more slowly than another. Keep uncertainty visible in your assessment and revisit the readings at a consistent interval. Don’t discard an inconvenient signal or force every measure into a single yes-or-no verdict.
Do market peak indicators mean investors should sell?
No. A broad market reading isn’t a personal sell instruction. An investor’s decision should reflect their goals, time horizon, financial circumstances, and investment plan. A signal can prompt someone to review whether their current risk exposure still fits that plan, but it can’t determine the answer for them. Alpha Shield Market Signal is a systematic market-risk monitoring tool, not individualized financial advice or a guarantee against losses.


